Mimecast API In Power BI
DISCLAIMER: The below tutorial is not supported under any Mimecast support program or service. The sample template is provided AS IS without warranty of any kind. Mimecast further disclaims all implied warranties including, without limitation, any implied warranties of merchantability or of fitness for a particular purpose.
Note: While the tutorials section of our site currently resides on our API 1.0 documentation site, the steps detailed below exclusively use our API 2.0 gateway and endpoints. We encourage all customers and partners that are building anything today to do so with our API 2.0 gateway.
Microsoft’s PowerBI is a robust and versatile tool which helps bring data analytics and business intelligence together. It empowers users with no-cost entry point into the realm of visual analytics and informed decision making.
Postman provides a clear visualization of API responses, making it easier to understand and work with the data. Using the Mimecast API 2.0 Collection, we can get a variety of endpoints to work around. After plugging in the Client ID, Client Secret, and the Authentication details, we can generate the OAuth2.0 Token, and start sending requests and receiving responses.
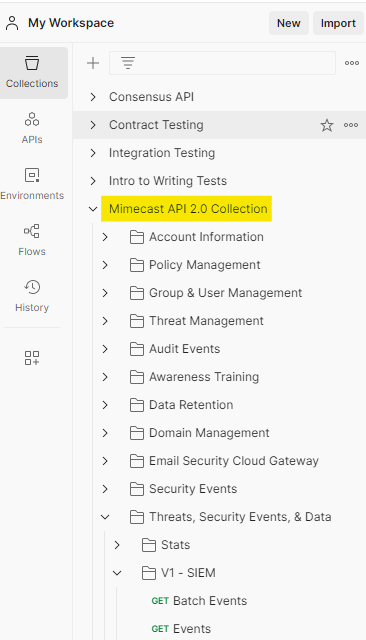
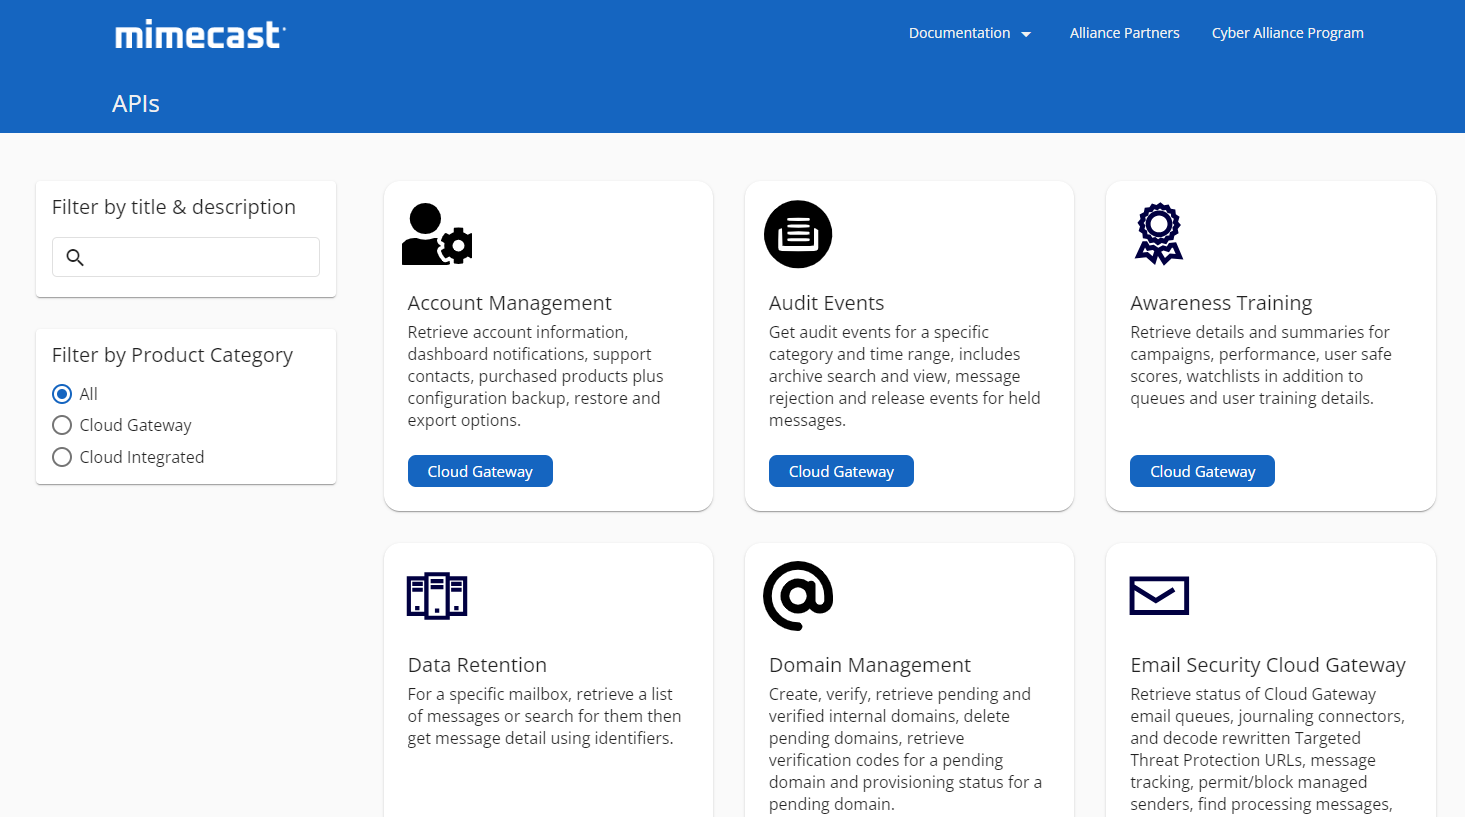
The Mimecast Developer Services help to understand how the APIs work, the parameters which may be needed and gives us all the information needed to customize the API responses we receive based on our business use case.
Getting Started with Power Bi
Downloading the Setup Application from Microsoft.
Go to the Power BI website for downloading the setup file.
https://www.microsoft.com/en-us/download/details.aspx?id=58494
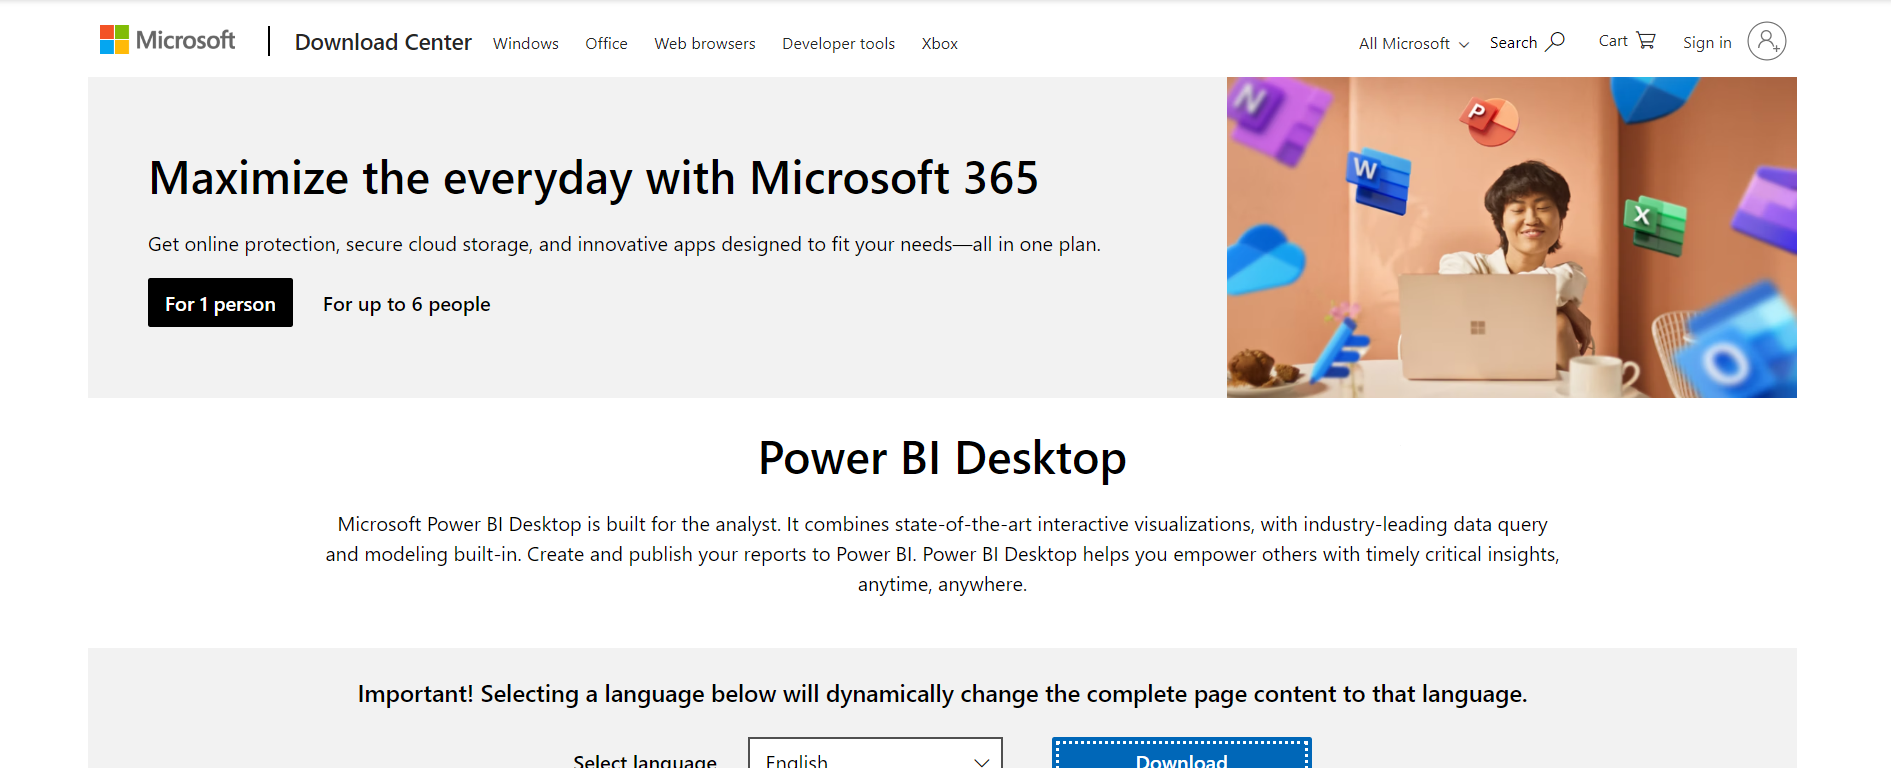
Once you have these files downloaded and Power BI is installed, open the application, and follow the initial setup steps to install and have the application running on your local desktop.
Step 1: Starting Point
Generate Your API Keys
The community link will help you generate your API Keys.
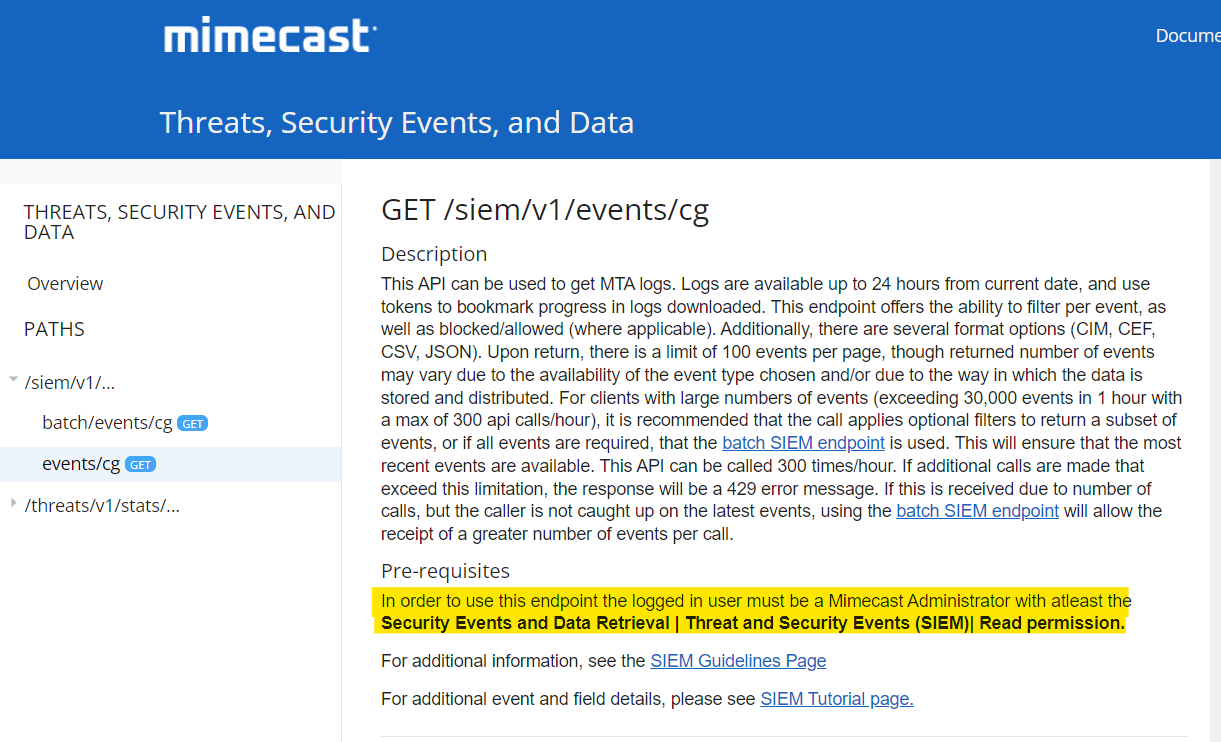
Every application created on the Administrative Console will function depending on the roles assigned to the logged in user generating the API application. The required permissions information is mentioned on the Mimecast Developer Services page for every endpoint.
Step 2: PowerBI Template
Import the PowerBI template to your local machine.
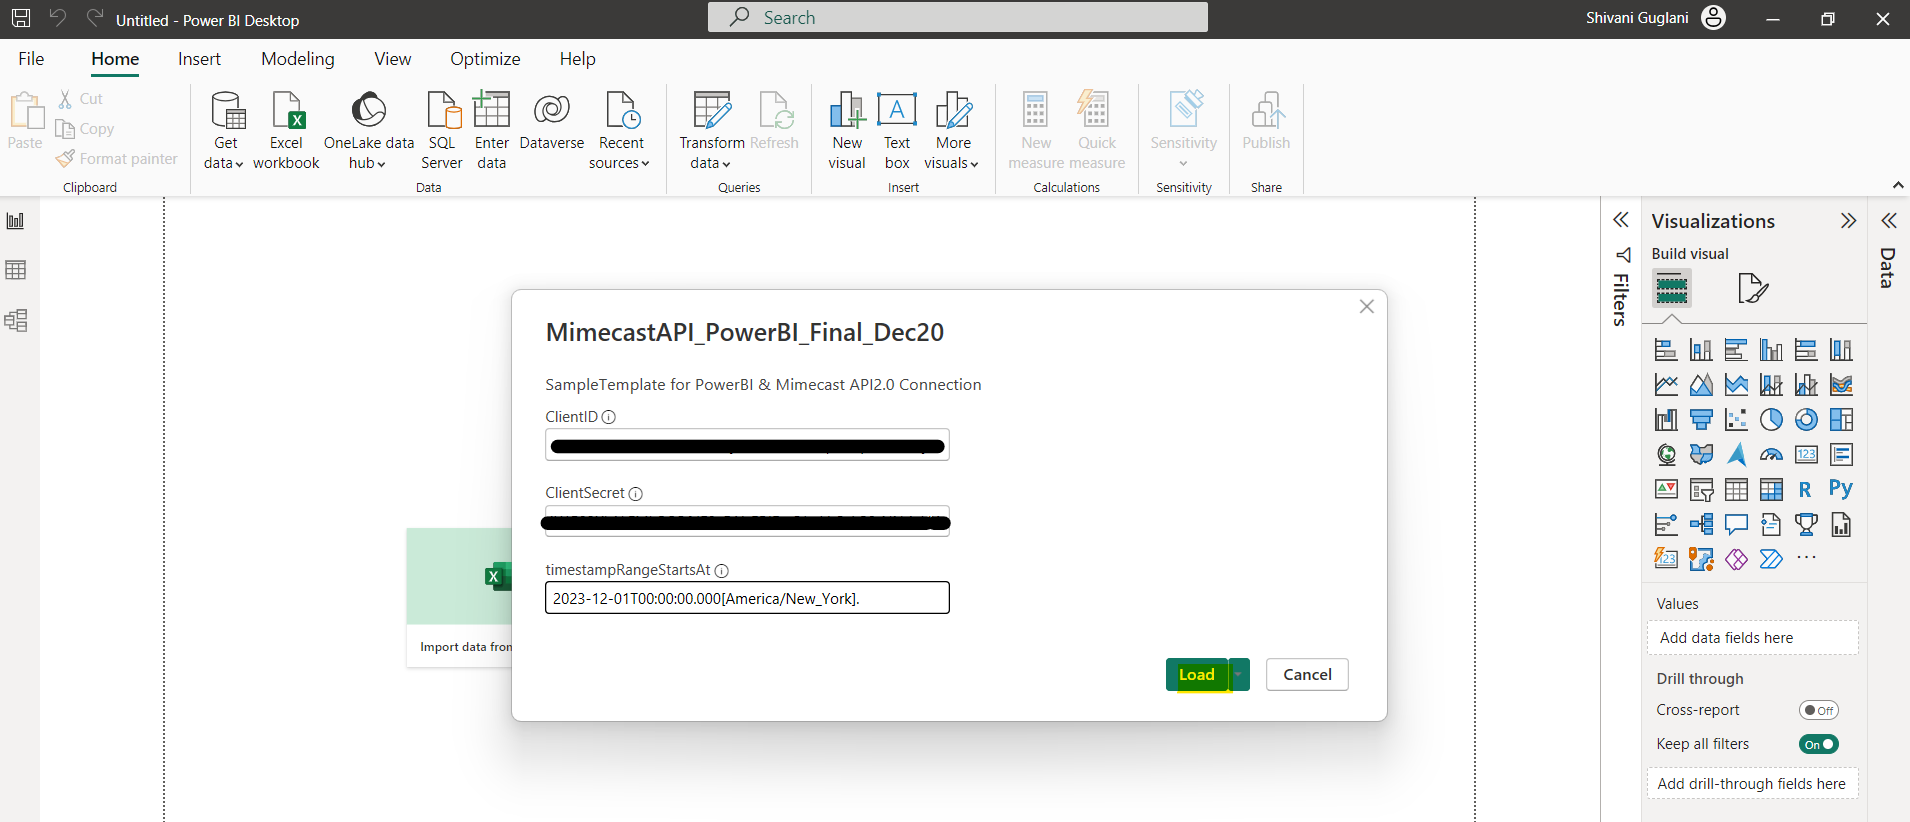
Add ClientID & Client Secret into the fields.
After generating the Client ID and Client Secret from the Administrative Console, we can use it to generate personalized connection directly into the API and receive responses.
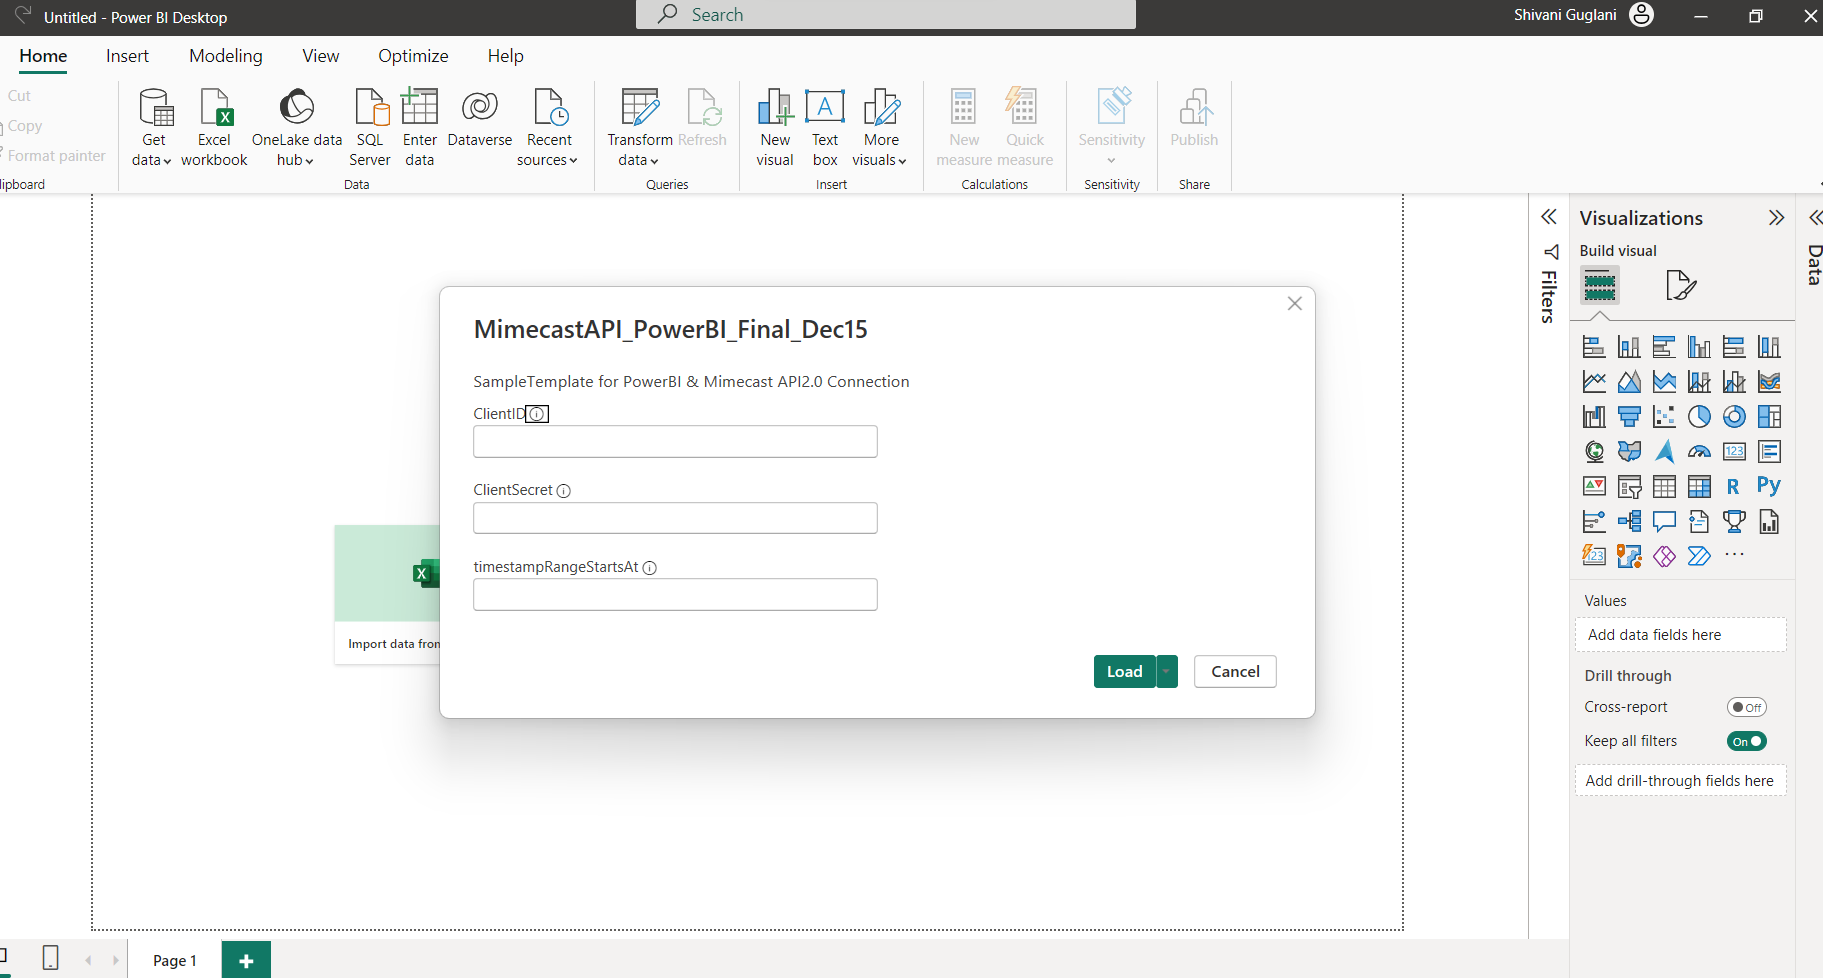
Step 3: Parameter Inputs
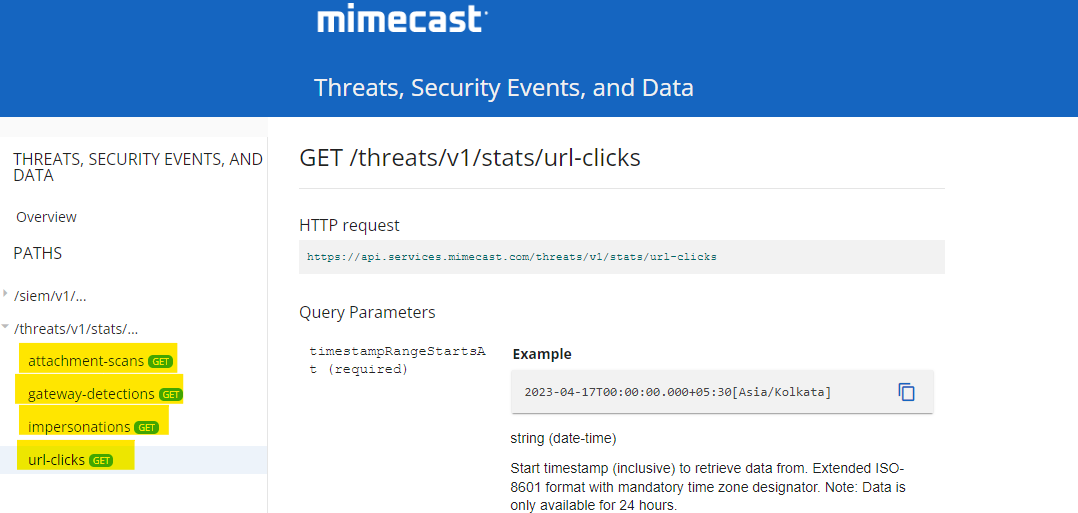
The timeStampRangeStartsAt parameter input.
The initial pop-up also asks for the timeStampRangeStartsAt parameter. This is a parameter for the stats endpoint, Attachment-Scans, Gateway-Detections, Impersonations & URL-Clicks. This is in the ISO 8601 Extended format.
For example,
1. 2023-12-01T00:00:00.000[America/New_York]
2. 2023-04-17T00:00:00.000+05:30[Asia/Kolkata]
Step 4: The Load Button
Click on Load button to get started.
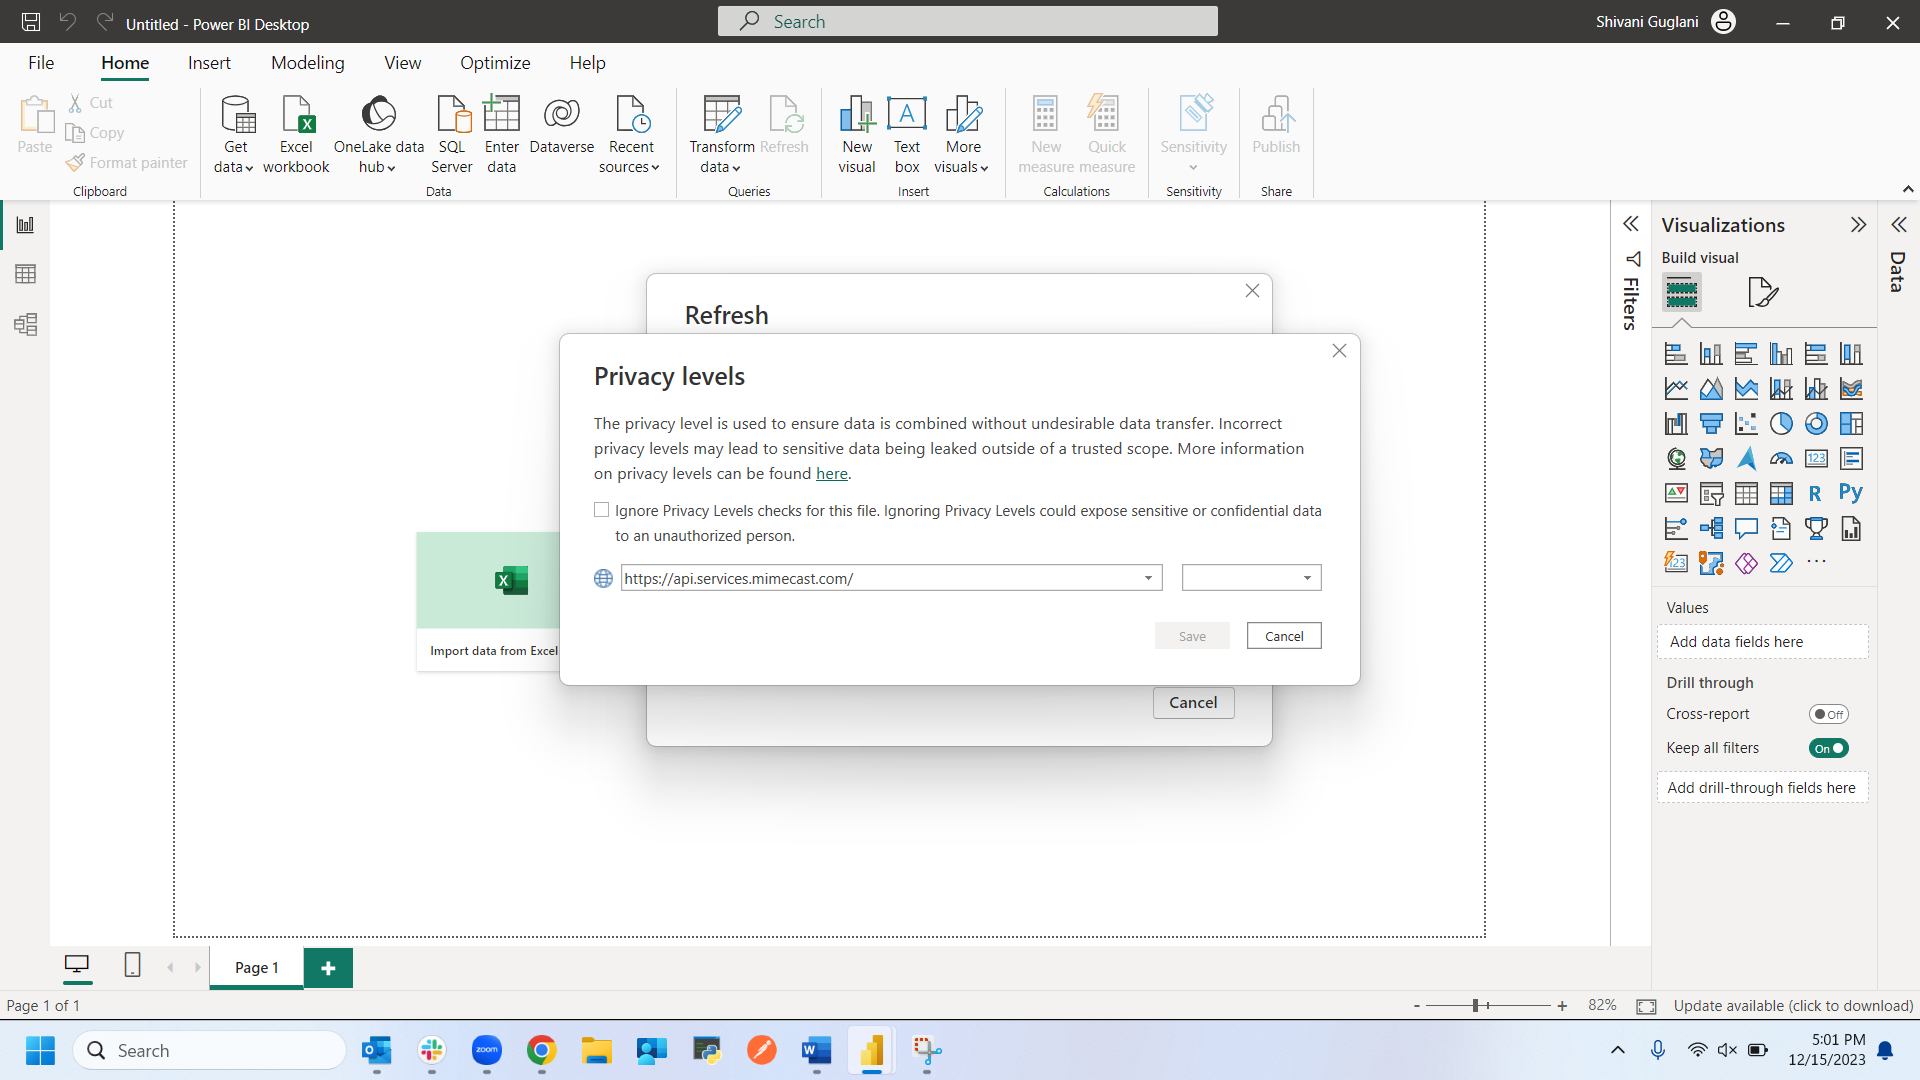
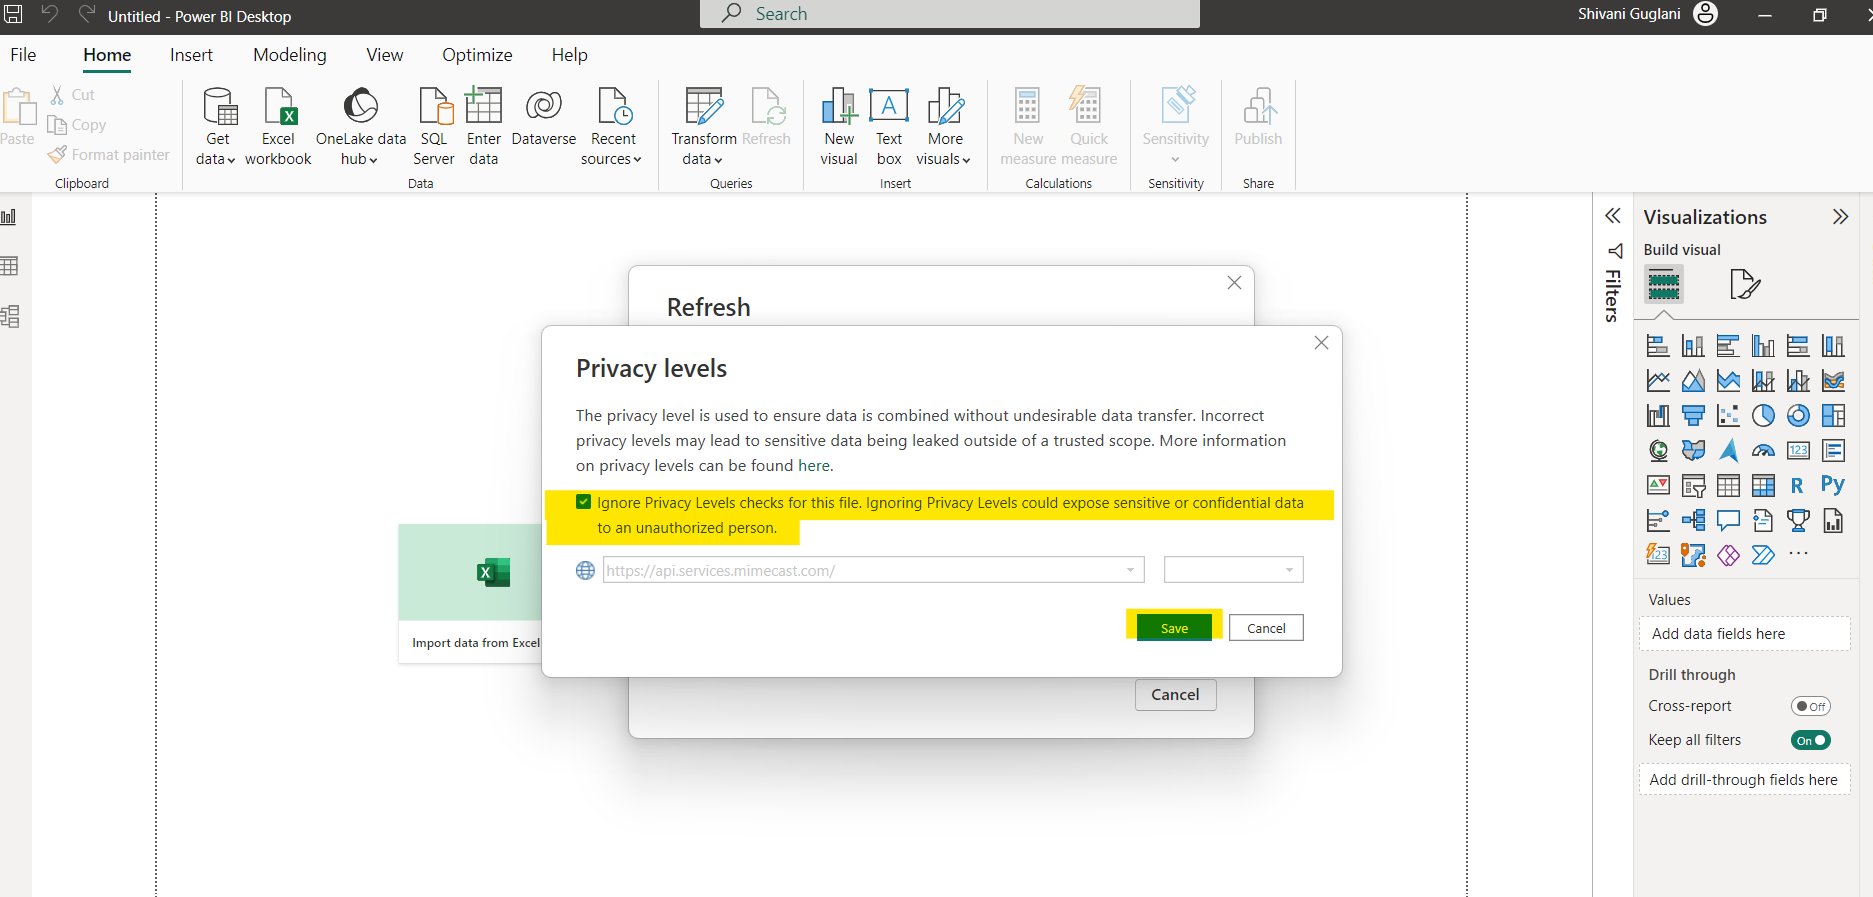
Step 5: Privacy Level Settings
For simplicity, ignore the privacy levels settings.
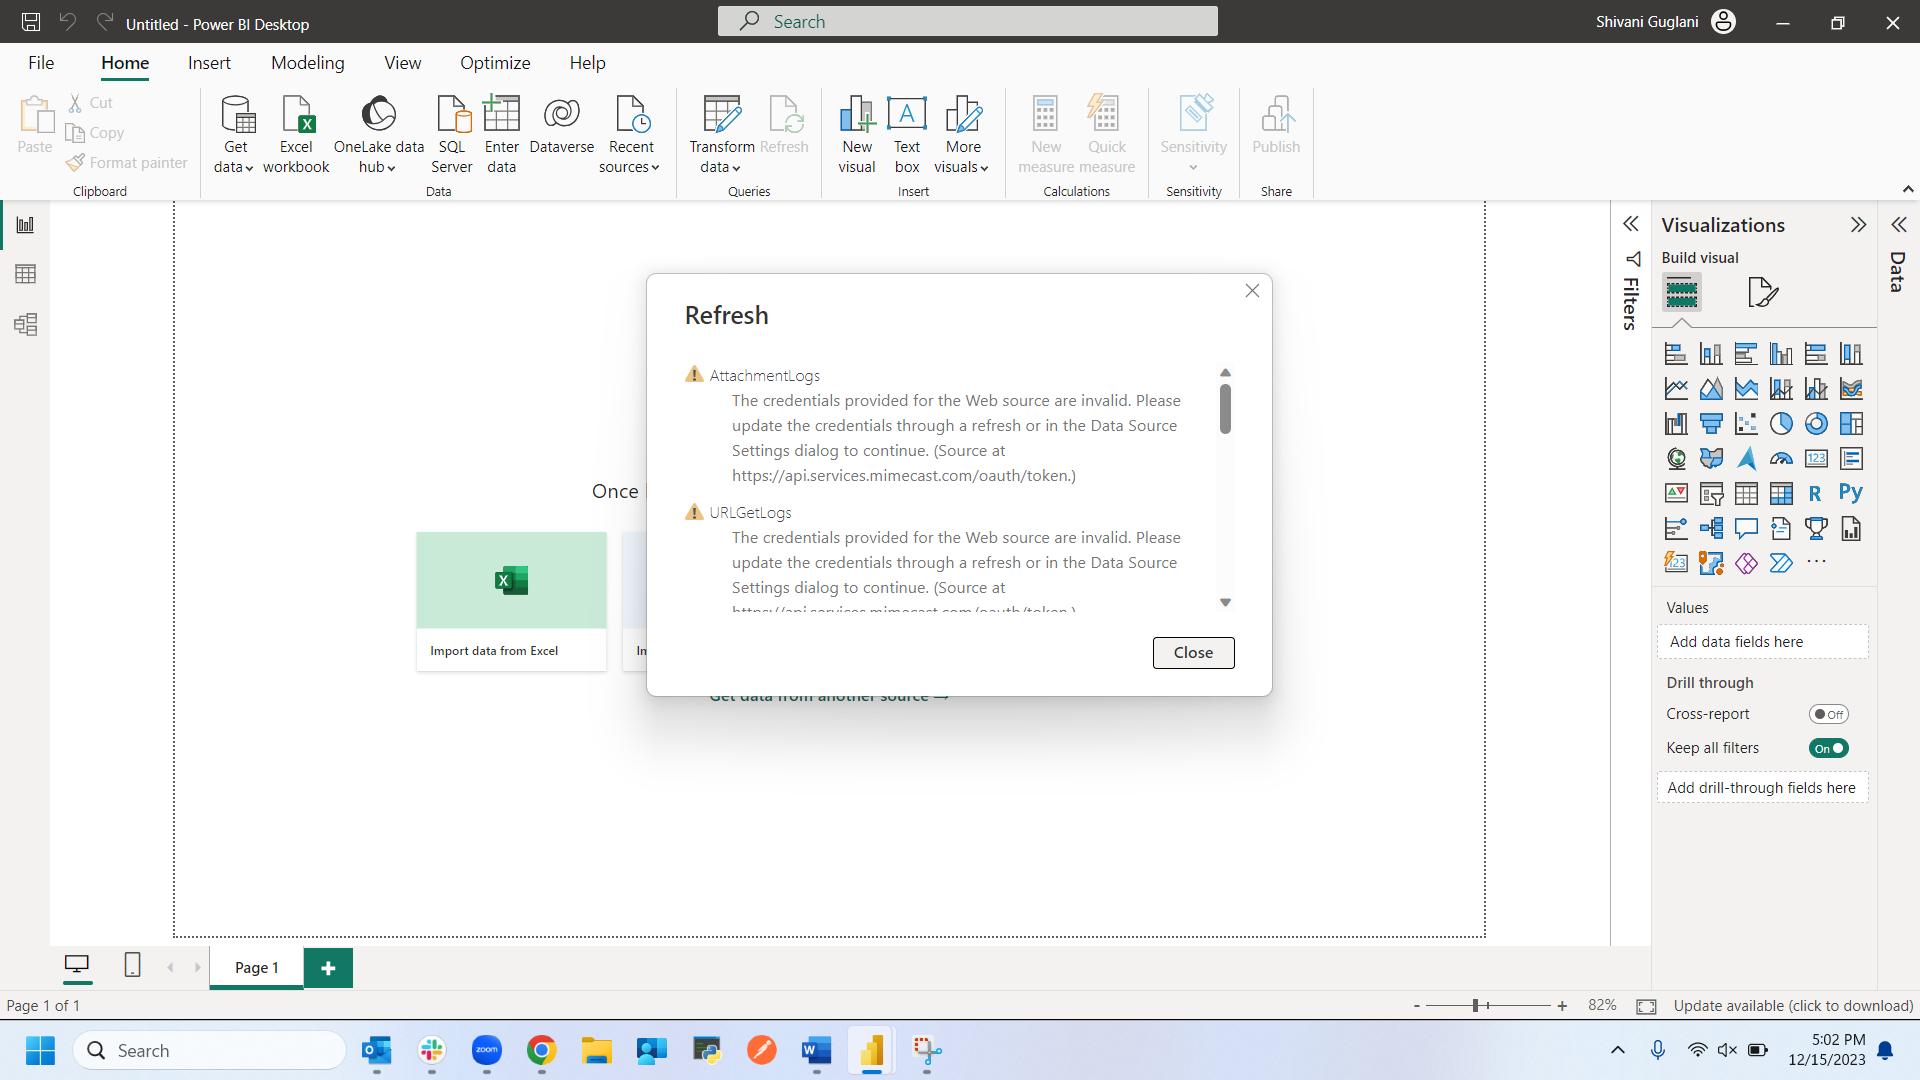
Step 6: Initial Errors Received
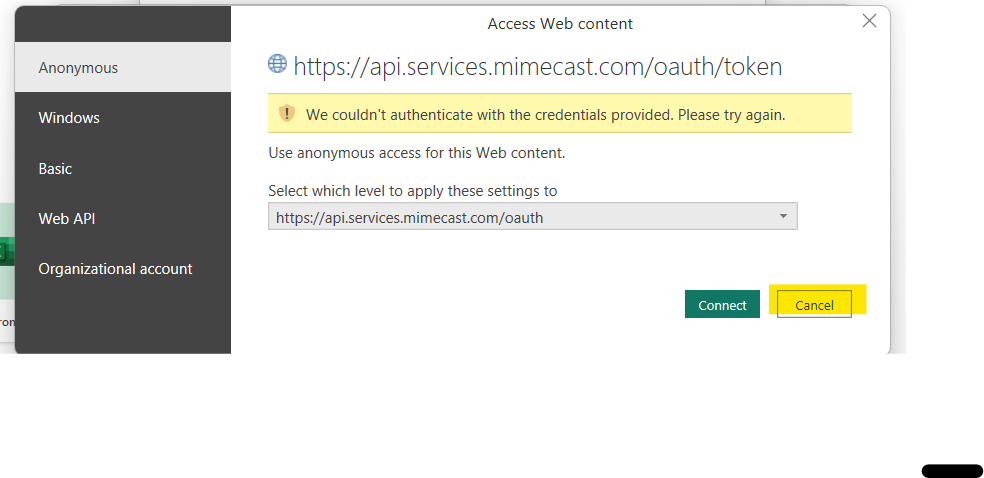
You may see some errors initially, and these can be ignored.
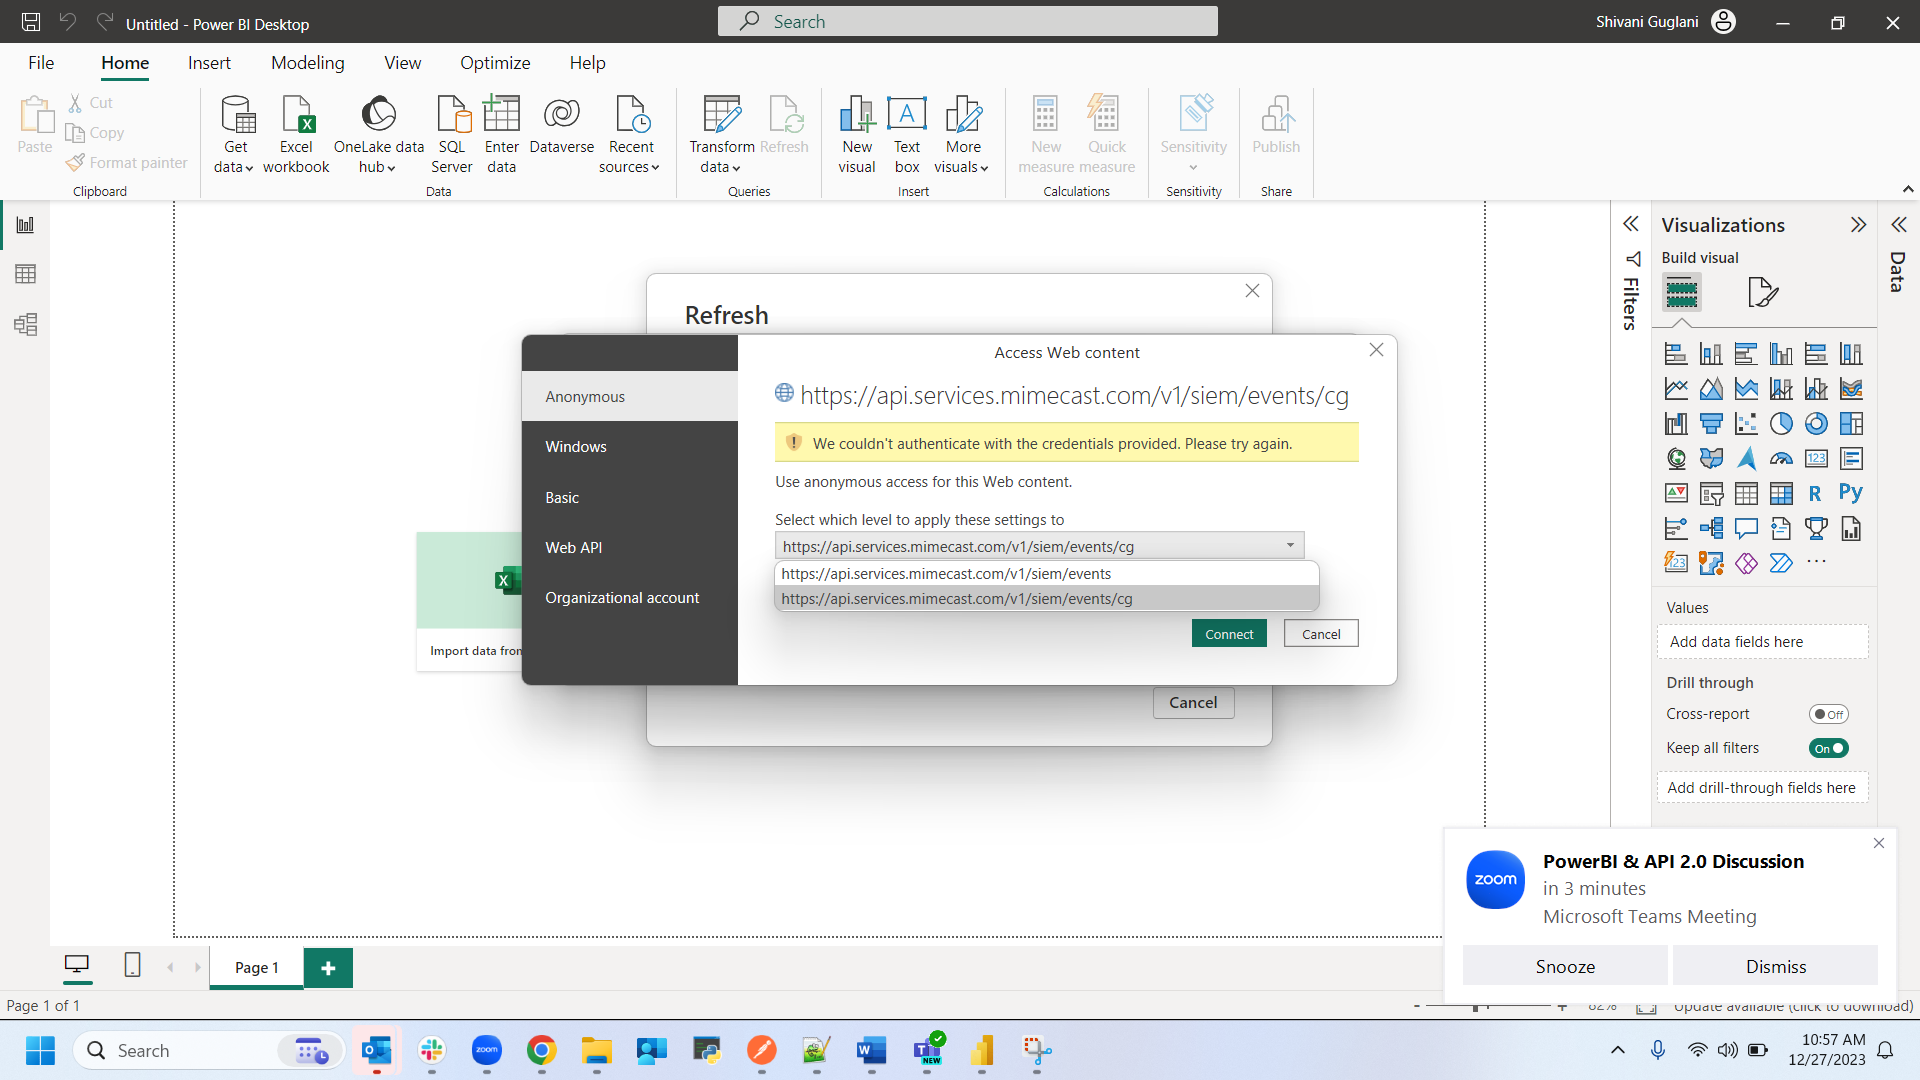
Any popup asking to set-up “Access Web Connect” can also be ignored. Also, in order to connect with the Mimecast API2.0, we have to use the Anonymous Web Access Method.
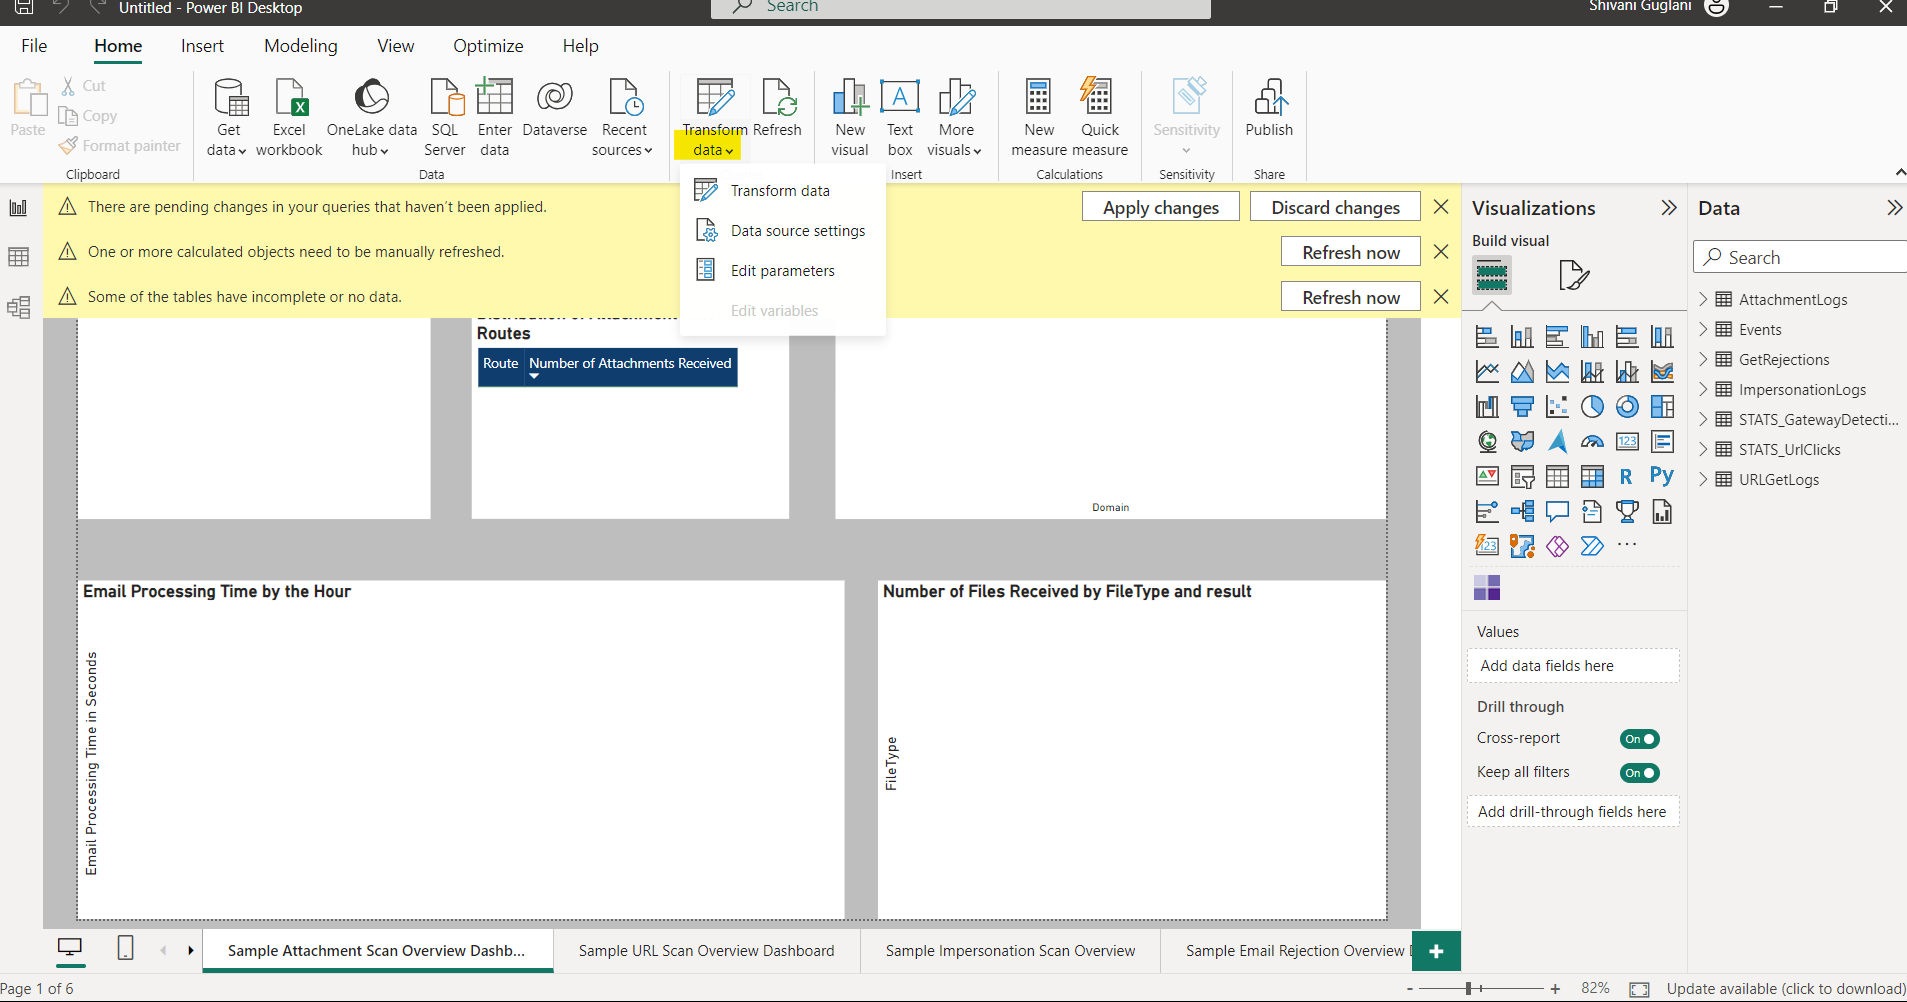
Step 7: Transformations
Click on “Transform Data”.
This will help us get to the Power Query window through which we can go to the Advanced Editor to edit and view the code and look at the data incoming from the API.
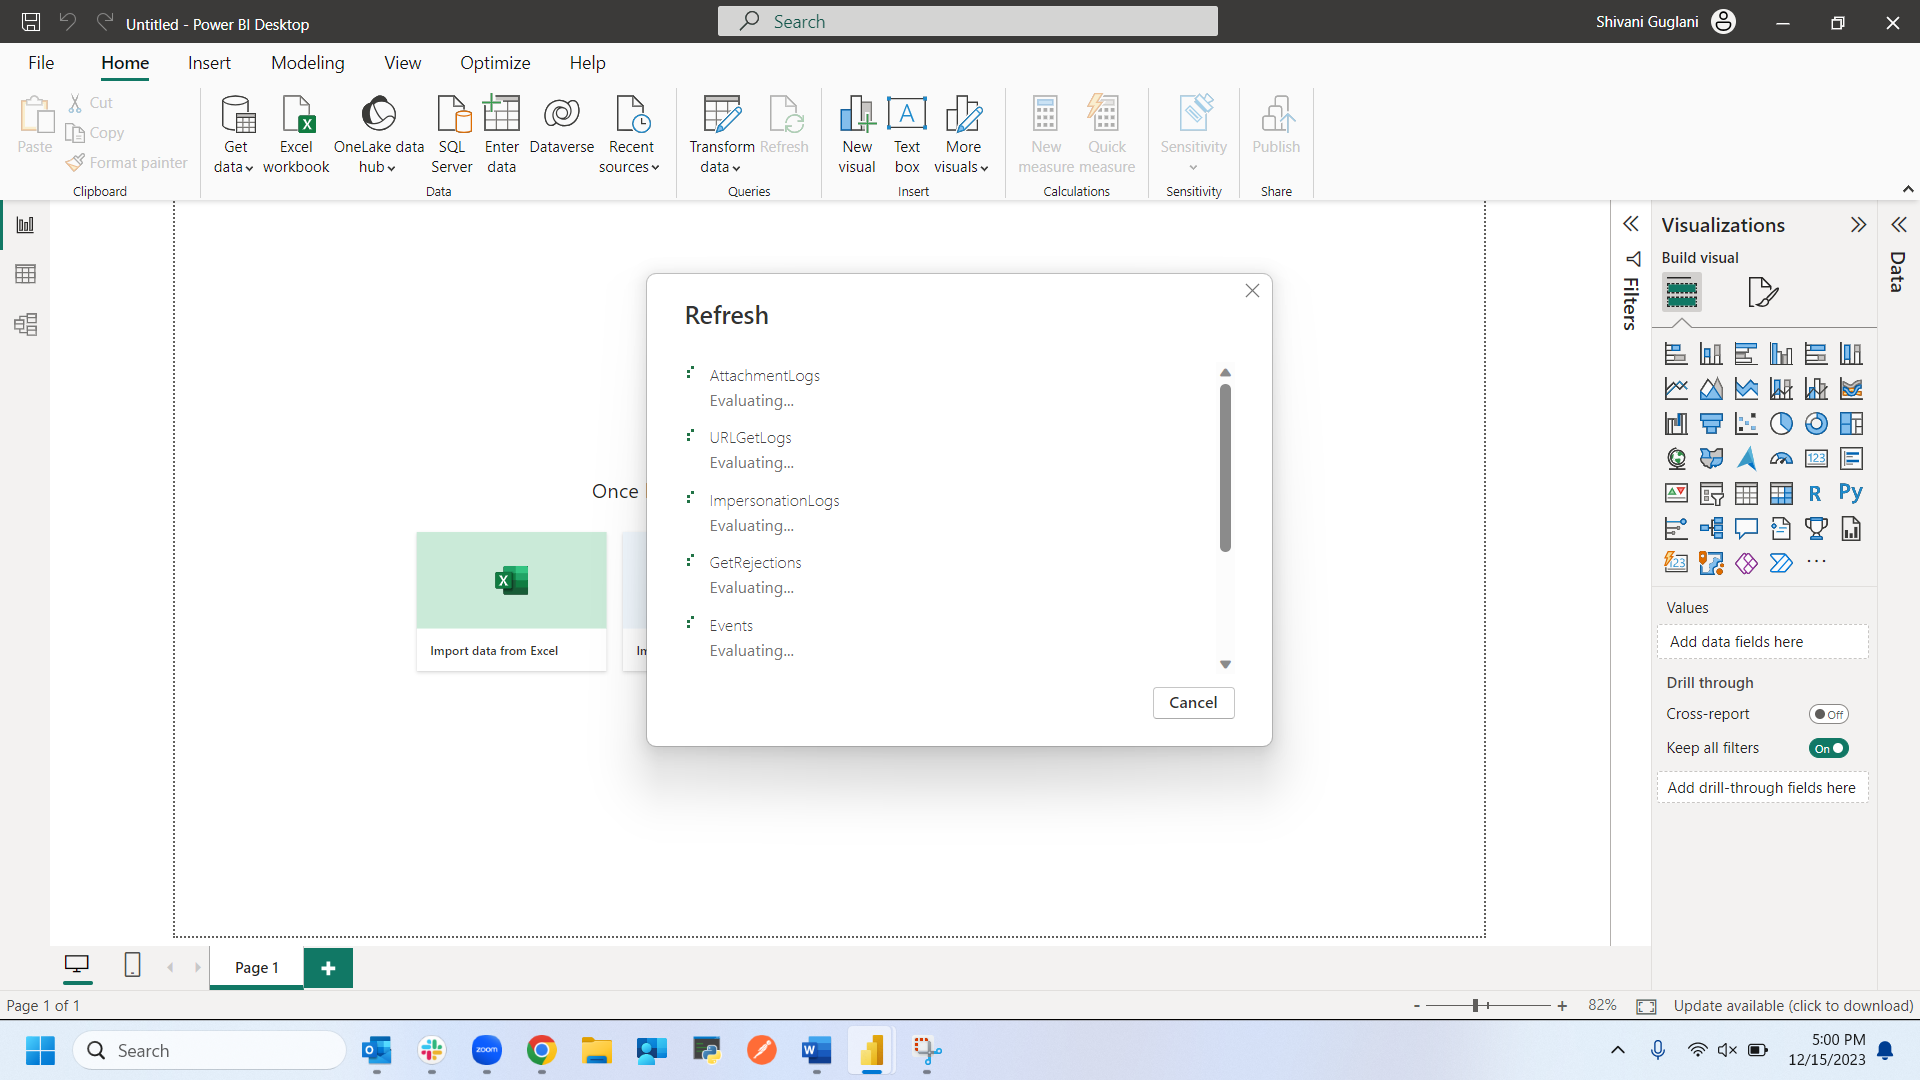
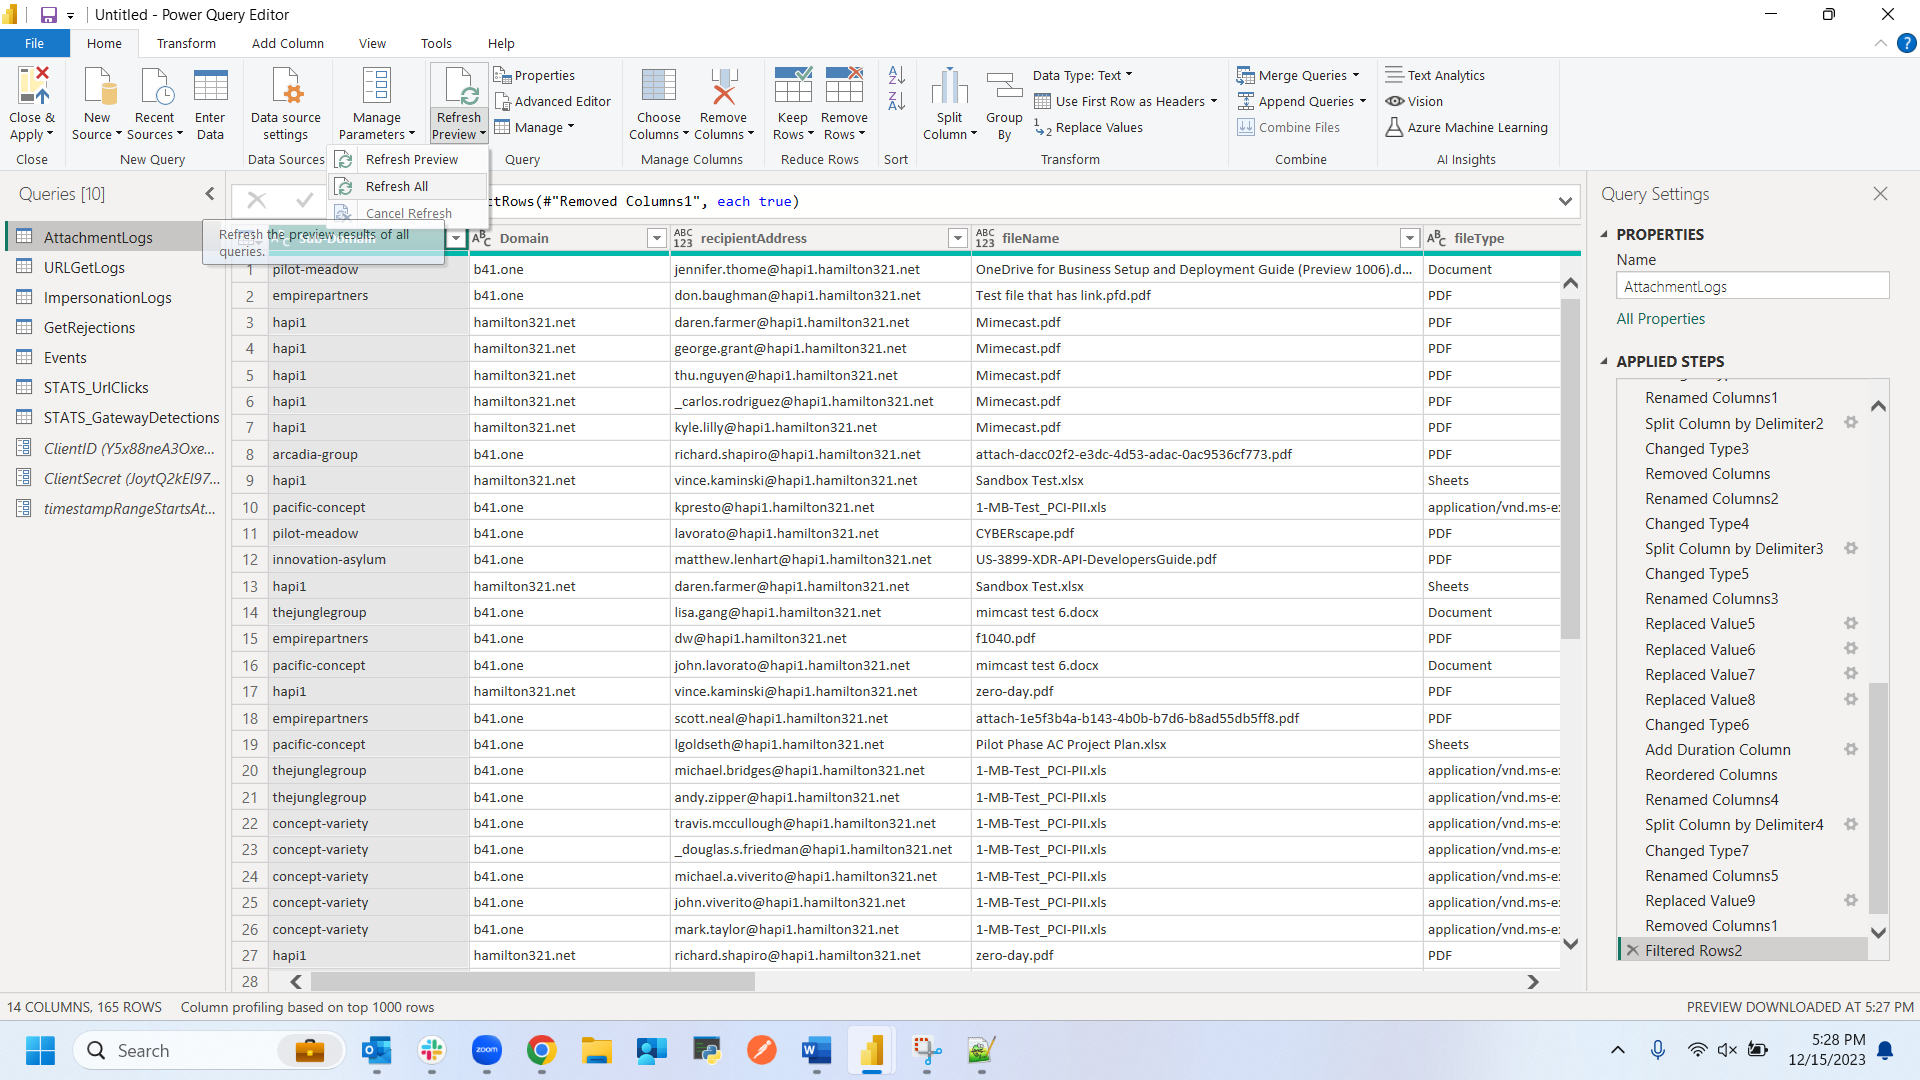
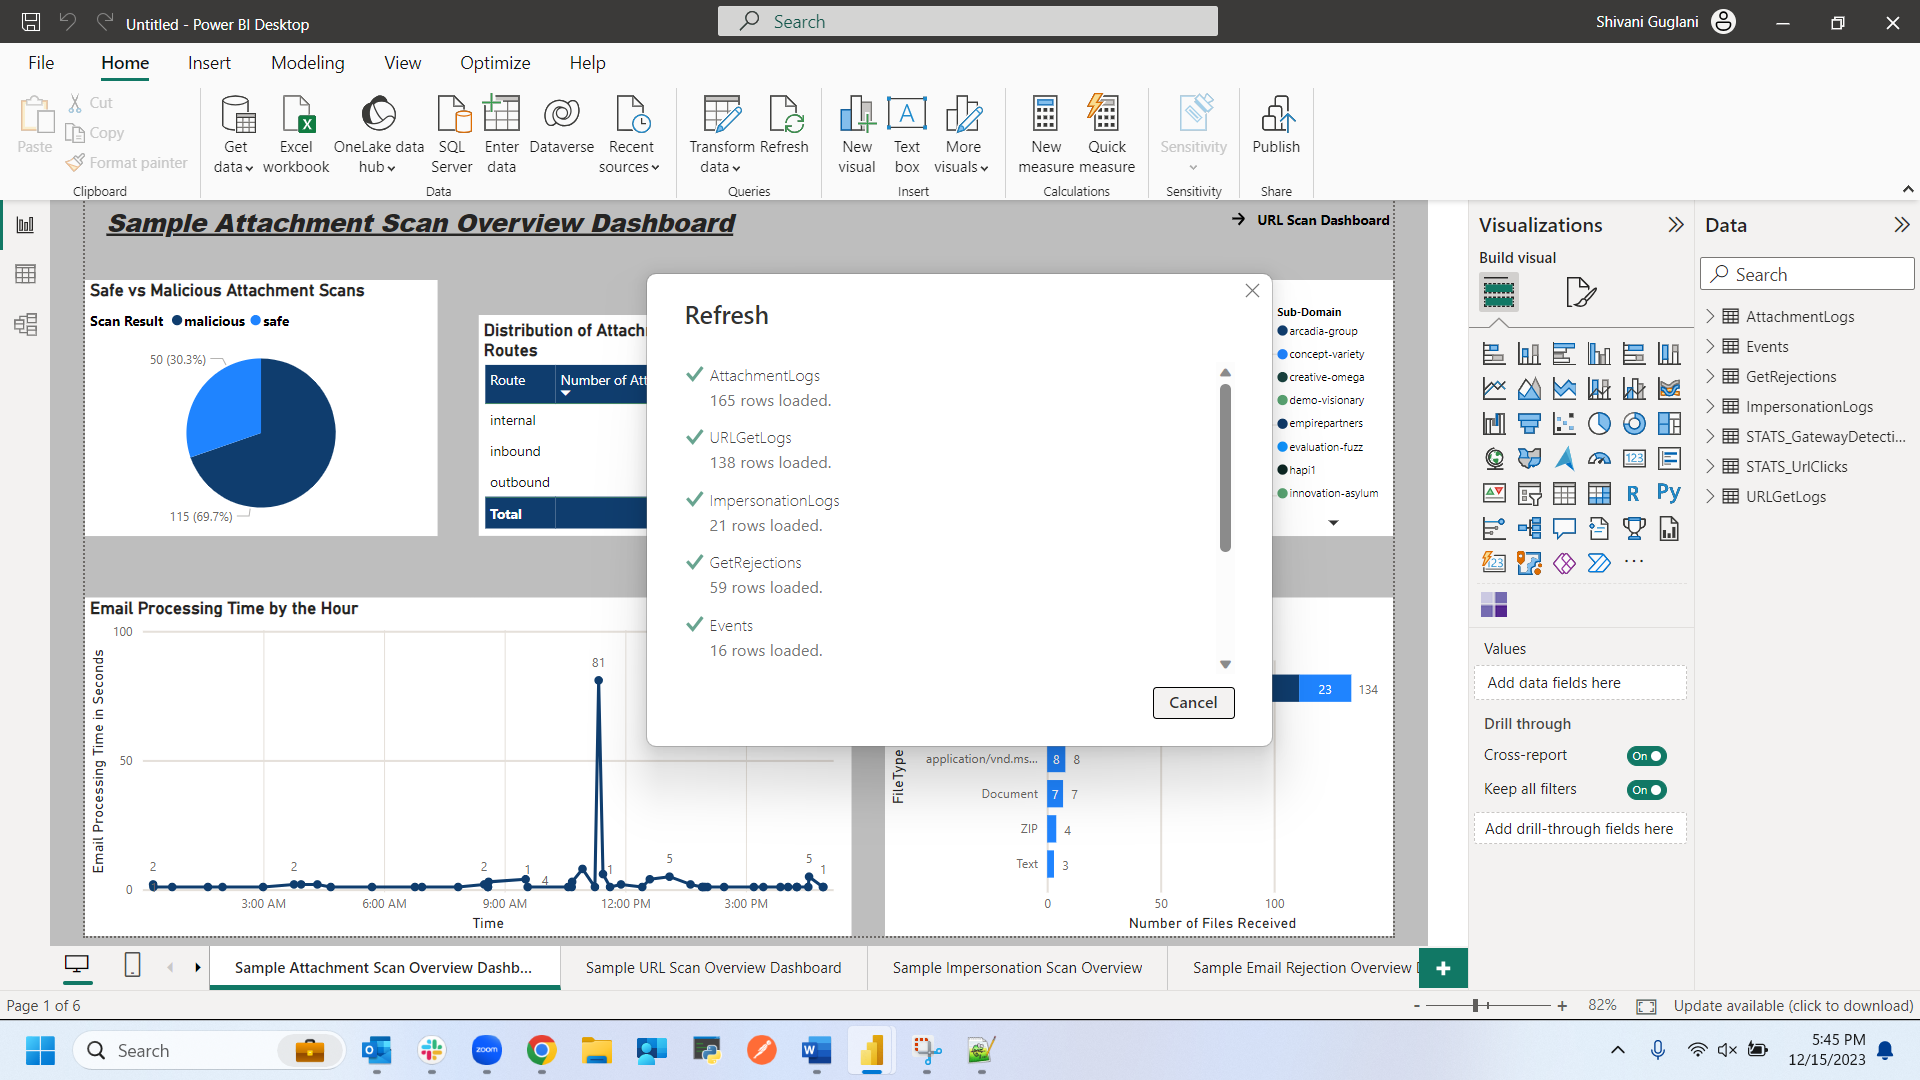
Step 8: Refresh ALL
Select Refresh All under the Refresh Button.
This should help get all the queries refreshed and ready to fetch data.
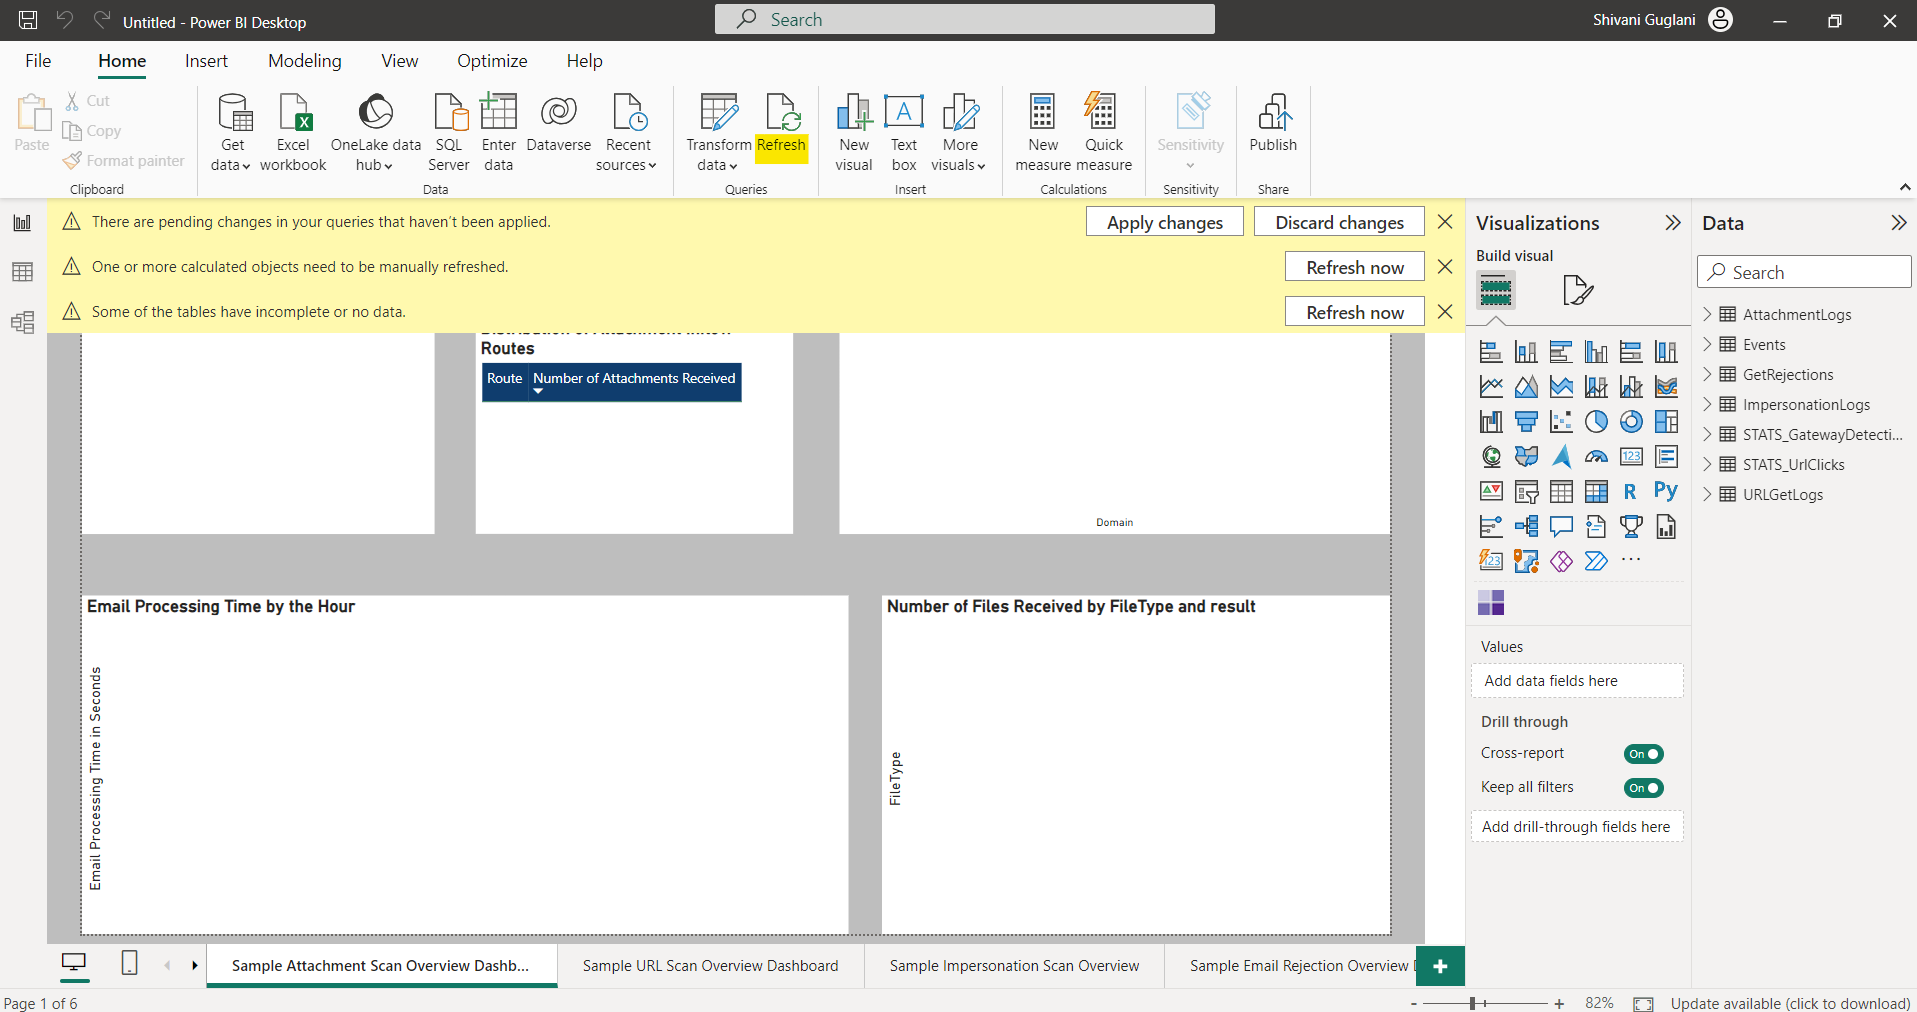
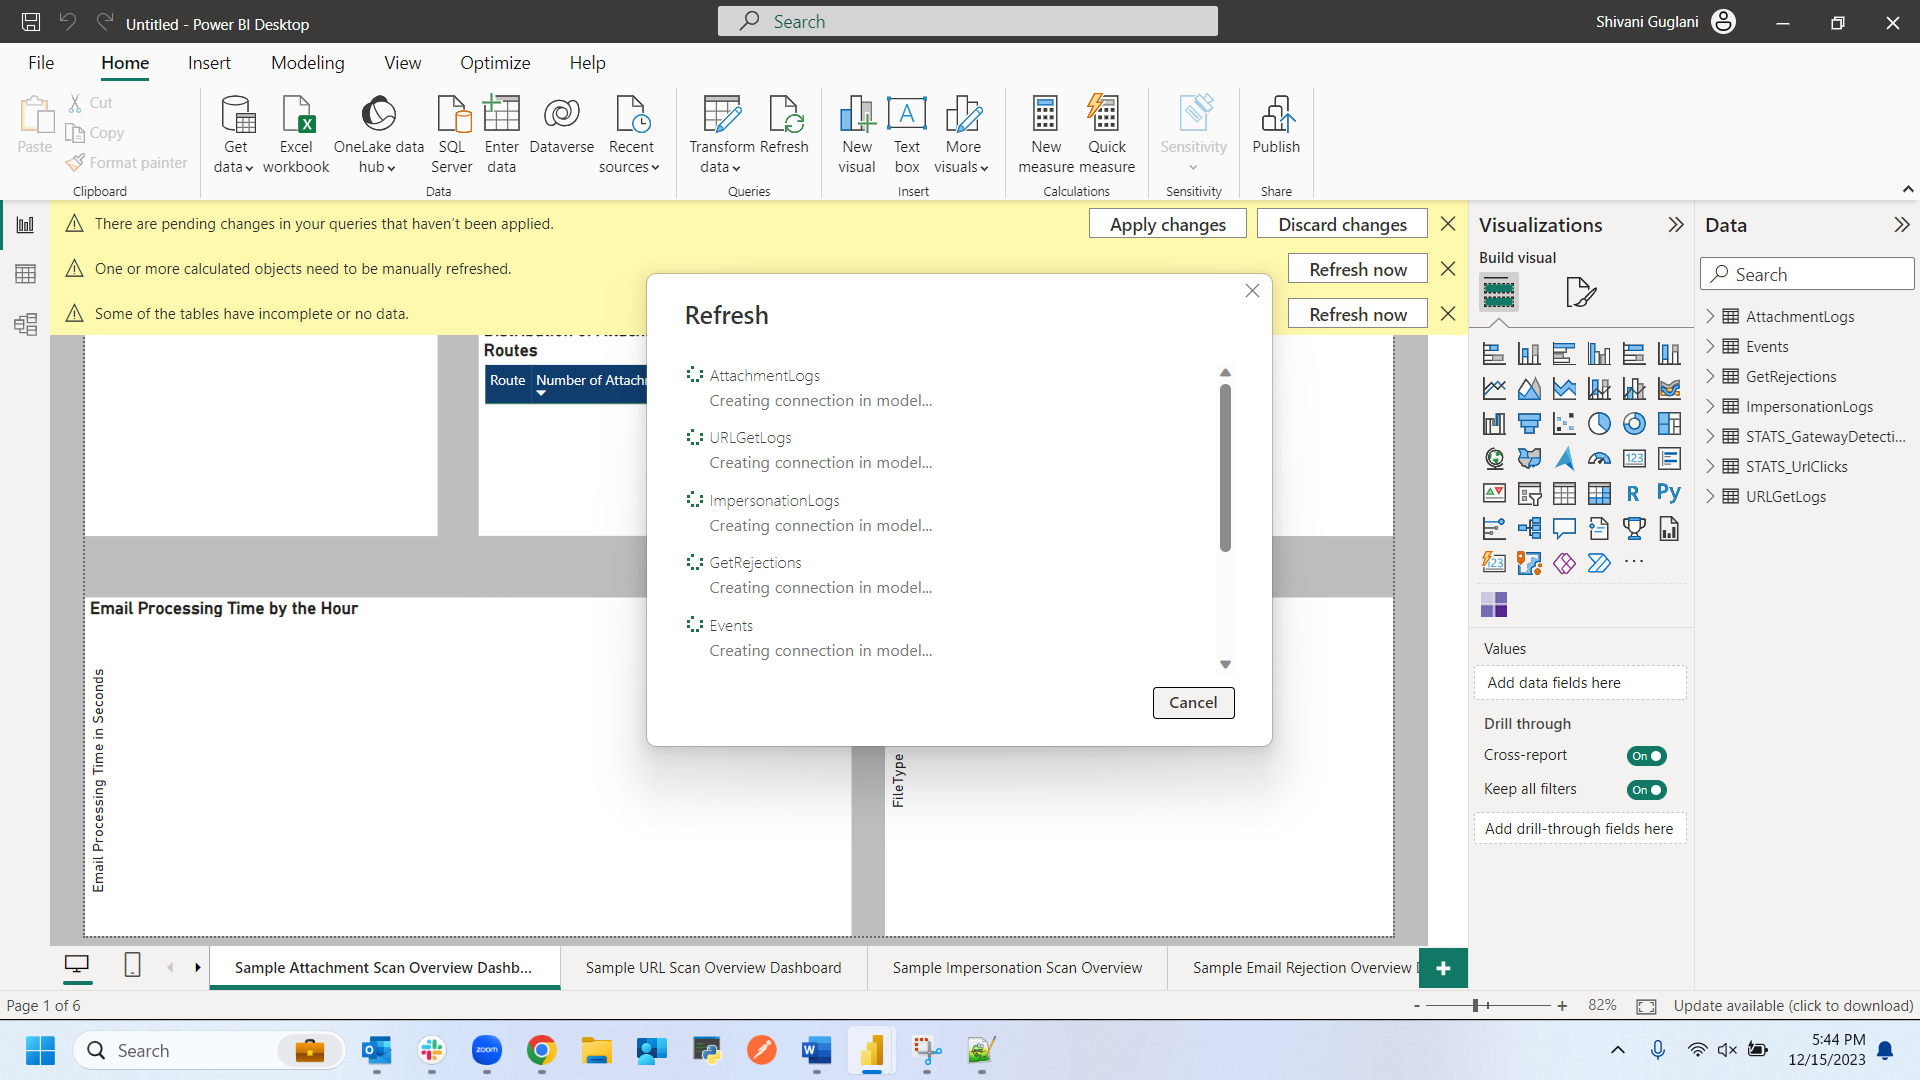
Step 9: Final Stretch!
Now, we go back to the Dashboard Workspace.
Finally, click on the Refresh button on the Dashboard Workspace and customize them as per use case.
Please Note: All the “Apply Changes” and “Refresh now” (bright yellow) banners will go away by themselves. The refresh action above will connect the graphs on the dashboard with refreshed data.
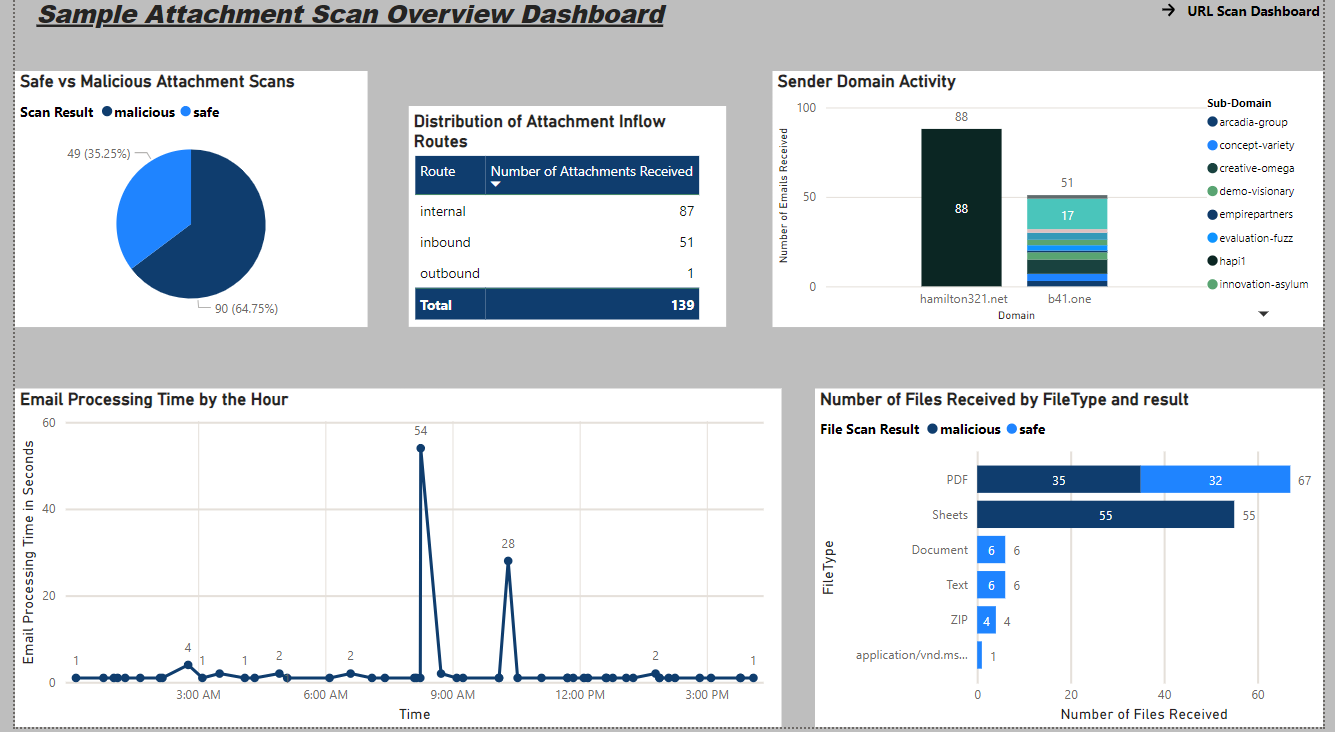
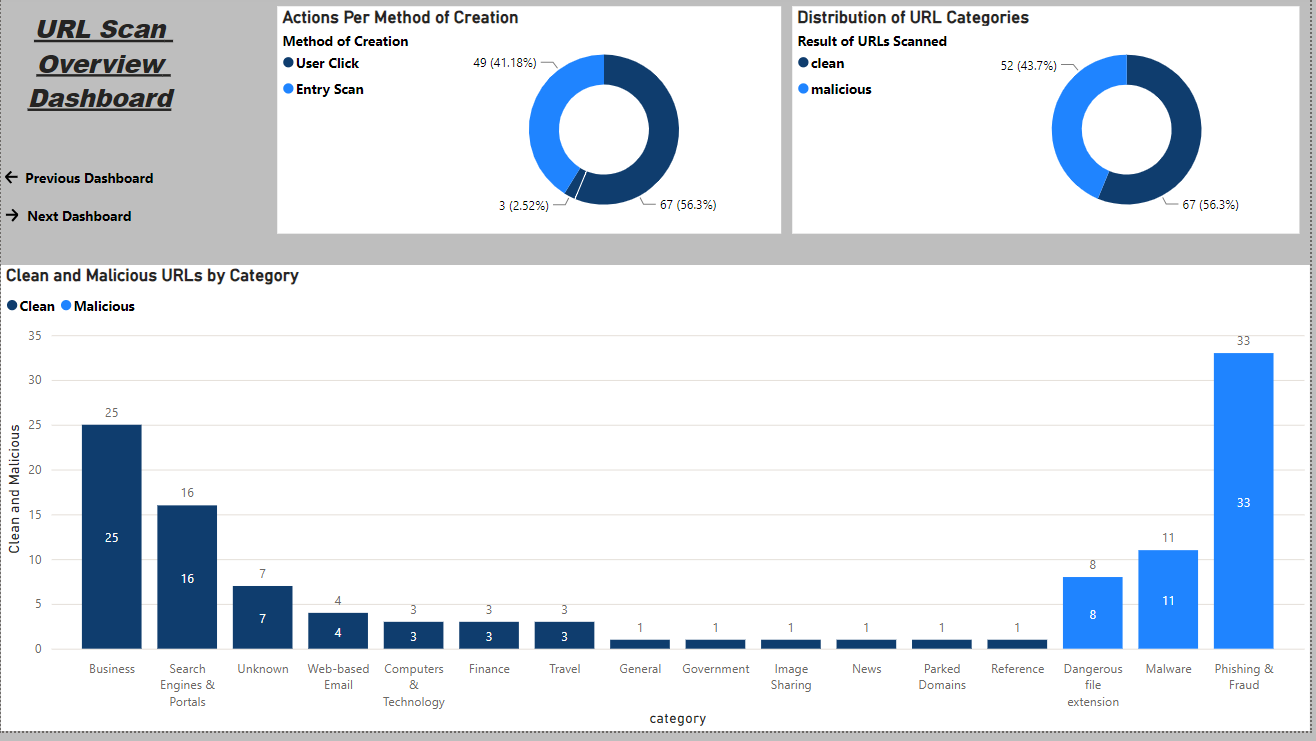
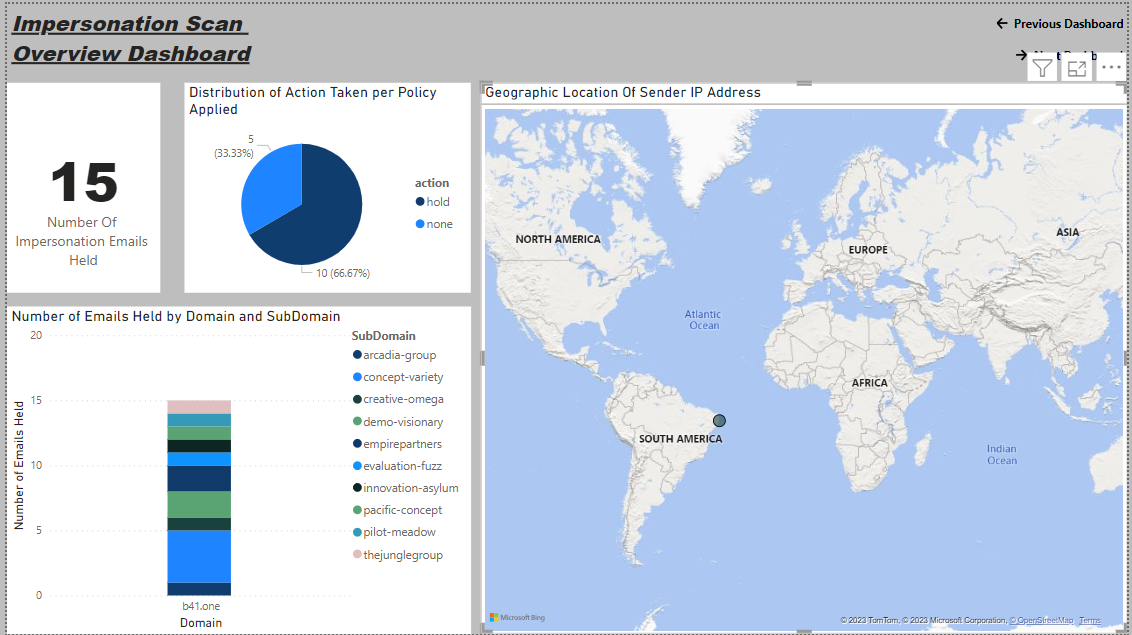
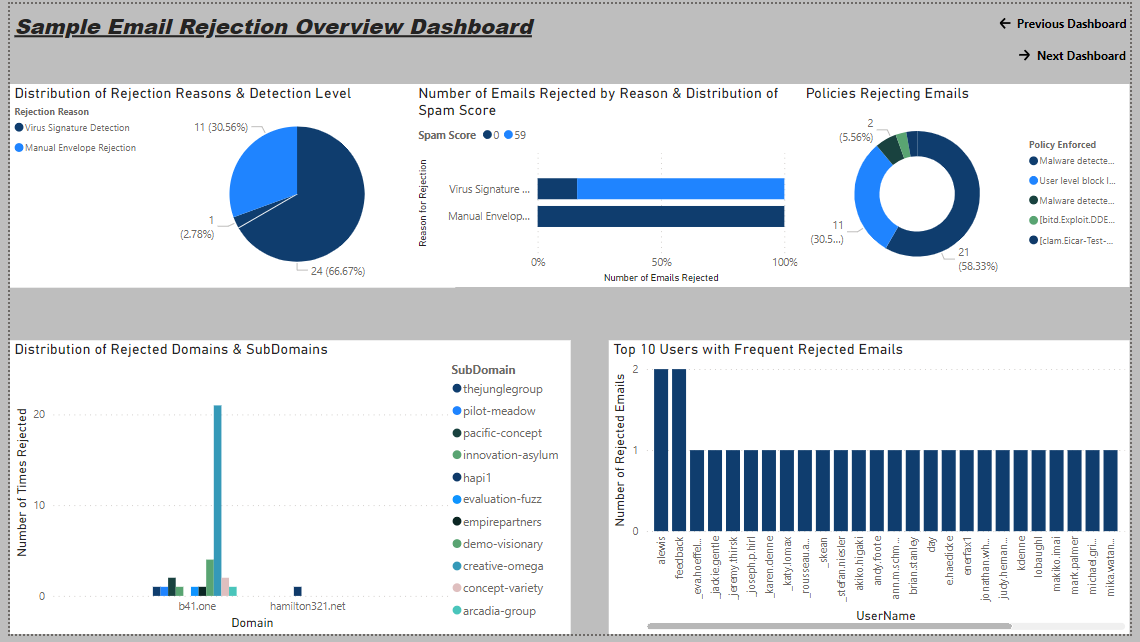
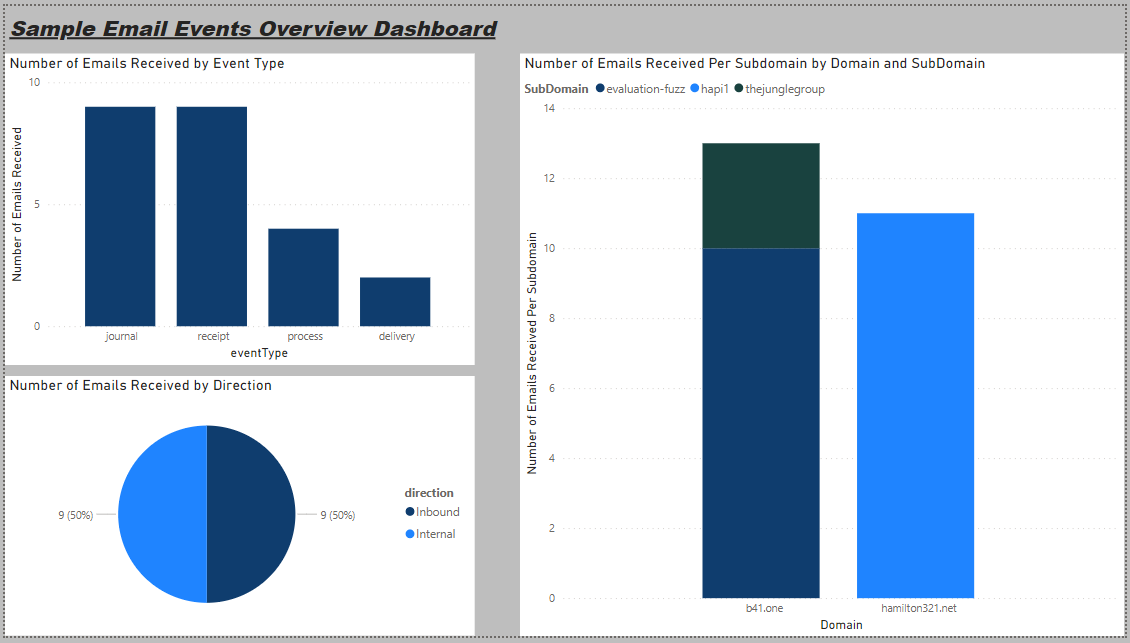
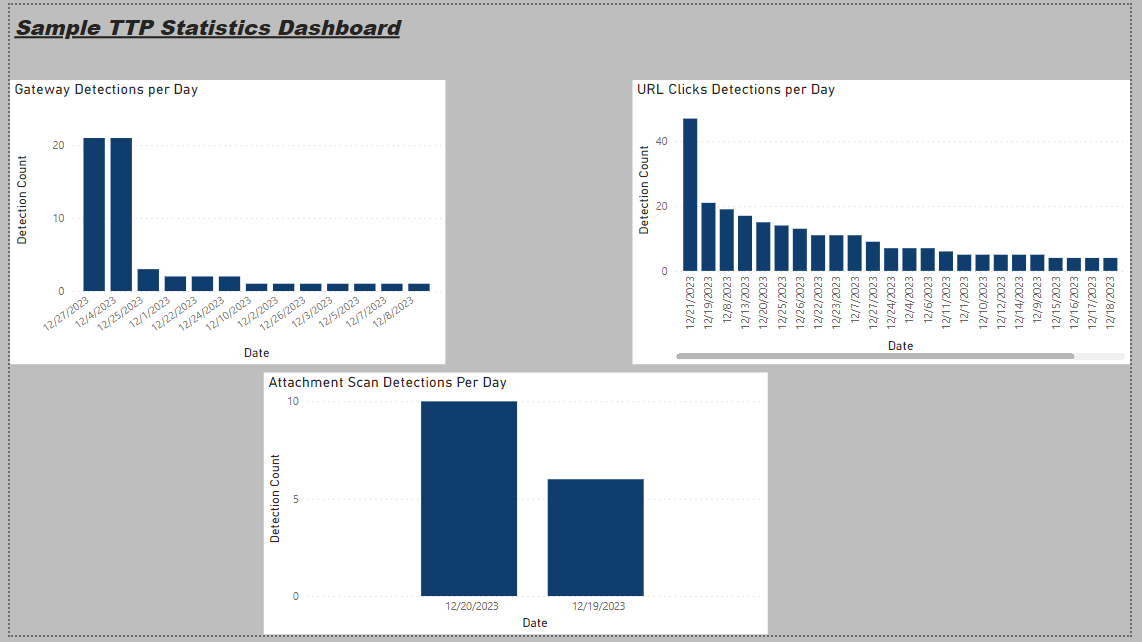
Sample Dashboards
Here are examples of what you may see once the data is retrieved.
The below dashboards are examples of what the visualizations would appear like when the data is retrieved from your API. These are only samples of what and how the data can be displayed graphically, and is highly customizable, so as to depict your own use case.
Comprehensive Code Deep Dive
Hypertext Transfer Protocol or HTTP supports various methods for communication between clients, such as web browsers, and servers. Two common methods which we use for grabbing the Mimecast API are GET and POST, and various endpoints are either of the two. The code is present in the Advanced Editor in Power Query, and you can make changes for further customizations.
Here’s an introduction to the Attachment Logs code which is a POST API endpoint. The GET API endpoints also has similar code blocks and show some code structuring differences.
1. We provide the API URL.
let

// Enter api url here

url = "https://api.services.mimecast.com/api/ttp/attachment/get-logs"
2. We then use the other parameters to get the Access Token which is later called and stored.
// Code block to get access token

clientId = Text.From(ClientID),

clientSecret = Text.From(ClientSecret),

tokenUrl = "https://api.services.mimecast.com/oauth/token",

scope = "api_scope", // Specify the required scope


// Function to obtain or refresh access token

getAccessToken = () =>

    let

        tokenResponse = Json.Document(

            Web.Contents(tokenUrl, [

                Content = Text.ToBinary("grant_type=client_credentials&client_id=" & clientId & "&client_secret=" & clientSecret & "&scope=" & scope),

                Headers = [#"Content-Type" = "application/x-www-form-urlencoded"]

            ])

        ),

        accessToken = tokenResponse[access_token],

        expiresIn = tokenResponse[expires_in],

        expirationDateTime = DateTime.LocalNow() + #duration(0, 0, 0, expiresIn),

        tokenInfo = [AccessToken = accessToken, ExpirationDateTime = expirationDateTime]

    in

        tokenInfo,


// Call the function to get the access token

tokenInfo = getAccessToken(),

accessToken = tokenInfo[AccessToken],
3. Since this is a POST API Endpoint, we perform pagination to obtain all rows with data and the response is then expanded in the form of a table. Here we can also add parameters to filter out the amount and type of data received.
// Function to get data and perform pagination

   gather = (outputData as list, nextPage) =>

        let

            jsonDataOptions = [

                meta = [

                    pagination = [

                        pageSize = 100,

                        pageToken = nextPage

                    ]

                ]


                // You can add multiple filters, refer https://developer.services.mimecast.com/docs/securityevents/1/routes/api/ttp/attachment/get-logs/post

                // Example: Uncomment below lines

                // ,data = {

                    // [

                        // from = "2023-11-26T14:49:18+0000",

                        // result = "malicious"

                    // ]

                // }


            ],

            options = [

				Headers = [#"Authorization" = "Bearer " & accessToken, #"Content-Type" = "application/json"],

                Content = Text.ToBinary(Text.FromBinary(Json.FromValue(jsonDataOptions)))

				],

			response = Json.Document(Web.Contents(url, options),1252),

			paginationMeta = response[meta][pagination],

			dataPage = response[data]{0}[attachmentLogs],


			outputData = List.Combine({outputData, dataPage}),


			check = if Record.HasFields(paginationMeta, "next")then  @gather(outputData, paginationMeta[next])  else outputData

        in check,


    outputList =  @gather({}, null),


    //Transform to table

    expand = Table.FromRecords(outputList),
4. In the final step, the expanded table of raw data is changed and updated as per the requirements for creating visualization. This step is highly customizable and can be performed as per use case.
//Data Transformation

    #"Filtered Rows3" = Table.SelectRows(expand, each true),

    #"Filtered Rows" = Table.SelectRows(#"Filtered Rows3", each true),

    #"Replaced Value" = Table.ReplaceValue(#"Filtered Rows","application/pdf","PDF",Replacer.ReplaceText,{"fileType"}),

    #"Replaced Value1" = Table.ReplaceValue(#"Replaced Value","application/zip","ZIP",Replacer.ReplaceText,{"fileType"}),

    #"Replaced Value2" = Table.ReplaceValue(#"Replaced Value1","application/vnd.openxmlformats-officedocument.wordprocessingml.document","Document",Replacer.ReplaceText,{"fileType"}),

    #"Replaced Value3" = Table.ReplaceValue(#"Replaced Value2","application/vnd.openxmlformats-officedocument.spreadsheetml.sheet","Sheets",Replacer.ReplaceText,{"fileType"}),

    #"Replaced Value4" = Table.ReplaceValue(#"Replaced Value3","application/x-7z-compressed","Compressed",Replacer.ReplaceText,{"fileType"}),

    #"Changed Type" = Table.TransformColumnTypes(#"Replaced Value4",{{"date", type datetime}}),

    #"Extracted Time" = Table.TransformColumns(#"Changed Type",{{"date", DateTime.Time, type time}}),

    #"Split Column by Delimiter" = Table.SplitColumn(#"Extracted Time", "senderAddress", Splitter.SplitTextByDelimiter("@", QuoteStyle.Csv), {"senderAddress.1", "senderAddress.2"}),

    #"Changed Type1" = Table.TransformColumnTypes(#"Split Column by Delimiter",{{"senderAddress.1", type text}, {"senderAddress.2", type text}}),

    #"Renamed Columns" = Table.RenameColumns(#"Changed Type1",{{"senderAddress.2", "Domain"}}),

    #"Filtered Rows1" = Table.SelectRows(#"Renamed Columns", each true),

    #"Split Column by Delimiter1" = Table.SplitColumn(#"Filtered Rows1", "details", Splitter.SplitTextByDelimiter("#(cr)", QuoteStyle.Csv), {"details.1", "details.2"}),

    #"Changed Type2" = Table.TransformColumnTypes(#"Split Column by Delimiter1",{{"details.1", type text}, {"details.2", type text}}),

    #"Renamed Columns1" = Table.RenameColumns(#"Changed Type2",{{"details.2", "TimeTaken"}}),

    #"Split Column by Delimiter2" = Table.SplitColumn(#"Renamed Columns1", "TimeTaken", Splitter.SplitTextByDelimiter(": ", QuoteStyle.Csv), {"TimeTaken.1", "TimeTaken.2"}),

    #"Changed Type3" = Table.TransformColumnTypes(#"Split Column by Delimiter2",{{"TimeTaken.1", type text}, {"TimeTaken.2", type text}}),

    #"Removed Columns" = Table.RemoveColumns(#"Changed Type3",{"TimeTaken.1"}),

    #"Renamed Columns2" = Table.RenameColumns(#"Removed Columns",{{"TimeTaken.2", "TimeTaken"}}),

    #"Changed Type4" = Table.TransformColumnTypes(#"Renamed Columns2",{{"TimeTaken", type text}}),

    #"Split Column by Delimiter3" = Table.SplitColumn(#"Changed Type4", "TimeTaken", Splitter.SplitTextByDelimiter(",", QuoteStyle.Csv), {"TimeTaken.1", "TimeTaken.2", "TimeTaken.3"}),

    #"Changed Type5" = Table.TransformColumnTypes(#"Split Column by Delimiter3",{{"TimeTaken.1", type text}, {"TimeTaken.2", type text}, {"TimeTaken.3", type text}}),

    #"Renamed Columns3" = Table.RenameColumns(#"Changed Type5",{{"TimeTaken.1", "TimeTaken_Hours"}, {"TimeTaken.2", "TimeTaken_Minutes"}, {"TimeTaken.3", "TimeTaken_Seconds"}}),

    #"Replaced Value5" = Table.ReplaceValue(#"Renamed Columns3","]"," ",Replacer.ReplaceText,{"TimeTaken_Seconds"}),

    #"Replaced Value6" = Table.ReplaceValue(#"Replaced Value5","hrs"," ",Replacer.ReplaceText,{"TimeTaken_Hours"}),

    #"Replaced Value7" = Table.ReplaceValue(#"Replaced Value6","min"," ",Replacer.ReplaceText,{"TimeTaken_Minutes"}),

    #"Replaced Value8" = Table.ReplaceValue(#"Replaced Value7","sec","",Replacer.ReplaceText,{"TimeTaken_Seconds"}),

    #"Changed Type6" = Table.TransformColumnTypes(#"Replaced Value8",{{"TimeTaken_Hours", Int64.Type}, {"TimeTaken_Minutes", Int64.Type}, {"TimeTaken_Seconds", Int64.Type}}),

    #"Add Duration Column" = Table.AddColumn(#"Changed Type6", "Duration", each [TimeTaken_Hours]*3600 + [TimeTaken_Minutes]*60 + [TimeTaken_Seconds]),

    #"Reordered Columns" = Table.ReorderColumns(#"Add Duration Column",{"senderAddress.1", "Domain", "recipientAddress", "fileName", "fileType", "result", "actionTriggered", "date", "details.1", "TimeTaken_Hours", "TimeTaken_Minutes", "TimeTaken_Seconds", "Duration", "route", "messageId", "subject", "fileHash", "definition"}),

    #"Renamed Columns4" = Table.RenameColumns(#"Reordered Columns",{{"date", "Time"}}),

    #"Split Column by Delimiter4" = Table.SplitColumn(#"Renamed Columns4", "Domain", Splitter.SplitTextByEachDelimiter({"."}, QuoteStyle.Csv, false), {"Domain.1", "Domain.2"}),

    #"Changed Type7" = Table.TransformColumnTypes(#"Split Column by Delimiter4",{{"Domain.1", type text}, {"Domain.2", type text}}),

    #"Renamed Columns5" = Table.RenameColumns(#"Changed Type7",{{"Domain.1", "Sub-Domain"}, {"Domain.2", "Domain"}}),

    #"Replaced Value9" = Table.ReplaceValue(#"Renamed Columns5","text/rtf","Text",Replacer.ReplaceText,{"fileType"}),

    #"Removed Columns1" = Table.RemoveColumns(#"Replaced Value9",{"senderAddress.1", "actionTriggered", "subject", "fileHash", "definition"}),

    #"Filtered Rows2" = Table.SelectRows(#"Removed Columns1", each true)

in

    #"Filtered Rows2"
A copy of this sample tutorial is available here.
“Please note that PowerBI is a tool separate from Mimecast, not affiliated with Mimecast and retains their own trademarks.”